Monitoring the way to Industrial SME 4.0
May 15, 2019
Dashboards are for the summer
August 13, 2019

Getting all the potential of monitoring electricity consumption.
To say that it is necessary to control electricity consumption is obvious. Any big company, small company, even all of us at home check at least the "electricity bills". In addition, in the industry, electricity consumption is not a negligible expense, however, having information such as "this month I consumed more than last month" is often not helpful enough when implementing improvements.
We have already seen how integrating Zabbix with network analyzers such as Circutor (https://www.muutech.com/en/monitoring-of-electrical-consumption-with-zabbix-and-circutor/) makes possible to monitor in real time very valuable information that allows us to improve the energy efficiency of our company and reduce such costly bills.
YAnd now that we have all that data, is it possible to get more information from it?
This is a Schneider energy server focused on working as a gateway and datalogger of different consumption sensors such as impulse meters or network analyzers (such as the Schneider IEM3255). One of the communication alternatives provided is Modbus TCP, so we can configure Zabbix to use this option.
We will configure a Zabbix template where we define different items for the IEM3255 that will be connected to the gateway:
We have already seen how integrating Zabbix with network analyzers such as Circutor (https://www.muutech.com/en/monitoring-of-electrical-consumption-with-zabbix-and-circutor/) makes possible to monitor in real time very valuable information that allows us to improve the energy efficiency of our company and reduce such costly bills.
YAnd now that we have all that data, is it possible to get more information from it?
Zabbix and other network analyzers.
There are a multitude of platforms and consumption analysis devices on the market that can be perfectly integrated with Zabbix. We will analyze how to integrate 2 devices representative of different manufacturers: Schneider COMX510 and Sennet DL172 Schneider COMX510 (manual - https://download.schneider-electric.com/files?p_enDocType=User+guide&p_File_Name=DOCA0098EN-09_ComX510_UserManual_EN.pdf&p_Doc_Ref=DOCA0098EN)This is a Schneider energy server focused on working as a gateway and datalogger of different consumption sensors such as impulse meters or network analyzers (such as the Schneider IEM3255). One of the communication alternatives provided is Modbus TCP, so we can configure Zabbix to use this option.
We will configure a Zabbix template where we define different items for the IEM3255 that will be connected to the gateway:

In this case a Modbus module (RTU and TCP) has been used for Zabbix (libzbxmodbus - https://github.com/v-zhuravlev/libzbxmodbus), which allows us to define items as "Simple Check" and will read Modbus records calling the function "modbus_read" and indicating:
It is a Sennet datalogger that will allow us to collect and store information from different consumer analysis devices, centralize the information and serve it for use. This device, like COMX510, allows the use of Modbus TCP to send data, however, in this case it also has the option of returning XML through a web service, which is what we will use.
Once again, we are going to have several devices connected to this datalogger, so we will create a template in Zabbix where we will define an item that will get the complete xml:
- IP (Zabbix macro with HOST IP)
- Modbus ID (macro defined in the template with the modbus id which changes for each device we connect)
- Modbus memory address
- Modbus function (3 - reading of registers)
- Data type (f - float)
- Weight of register bytes (0 - Mid-Little Endian).
Sennet DL172
(manual - http://support.satel-iberia.com/wp-content/uploads/2015/02/Datalogger-Sennet-DL150-DL151-DL170-DL171-DL172-v3.pdf)It is a Sennet datalogger that will allow us to collect and store information from different consumer analysis devices, centralize the information and serve it for use. This device, like COMX510, allows the use of Modbus TCP to send data, however, in this case it also has the option of returning XML through a web service, which is what we will use.
Once again, we are going to have several devices connected to this datalogger, so we will create a template in Zabbix where we will define an item that will get the complete xml:
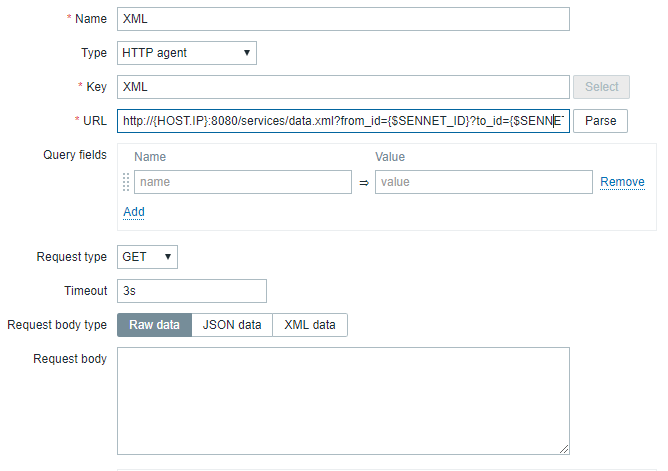
We declare it as an HTTP agent, the URL will be the one provided by the device, and we will define the macros of the template: device id, user and password.
URL: http://{HOST.IP}:8080/services/data.xml?from_id={$SENNET_ID}?to_id={$SENNET_ID}?user={$SENNET_USER}?password={$SENNET_PASS}
We will get in this item the complete xml with all the information.
<dl id="4C:3F:D3:AA:BB:CC" sn="19032">
<dev id="2" name="Horno" type="INTERNAL_3PH" class="energy" t="2019-07-22T00:36:00">
	<ch id="1" des="ENEact (kWh)" u="kWh" db="Y" gr="Y">8976.0ch>
	<ch id="2" des="ENERea (kvarh)" u="kvarh" db="N" gr="N">6860.3ch>
	<ch id="3" des="ENEApa (kvah)" u="kvah" db="N" gr="N">11388.5ch>
	<ch id="7" des="ENEact1 (kWh)" u="kWh" db="N" gr="N">2927.2ch>
	<ch id="8" des="ENEact2 (kWh)" u="kWh" db="N" gr="N">2913.6ch>
	<ch id="9" des="ENEact3 (kWh)" u="kWh" db="N" gr="N">3135.1ch>
	…
dev>
From this item, we will create new "Dependent item" that will process the xml to take the information of each variable. For example, to collect the Active Energy of Phase 1 (ENEAct1), we will create an item:
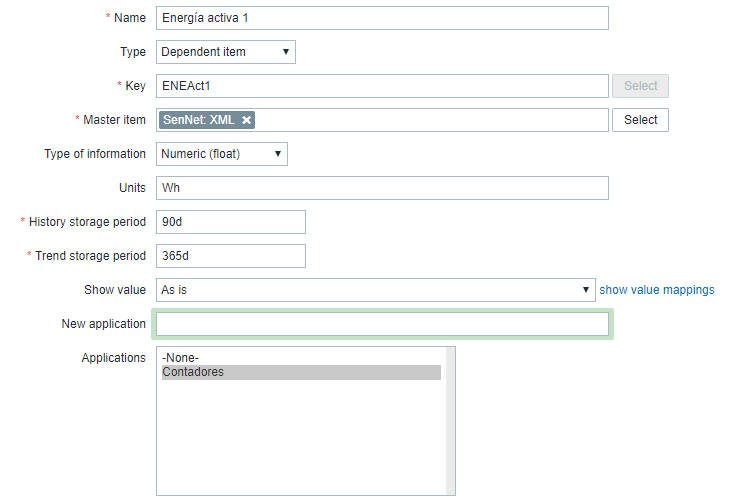
Where we will define a preprocessed with the following characteristics:

XML XPATH: /dl/dev[@id='{$SENNET_ID}']/ch[@des='ENEact1 (kWh)']/text()and we also add a necessary multiplier in this case.
Comparison of devices from different manufacturers.
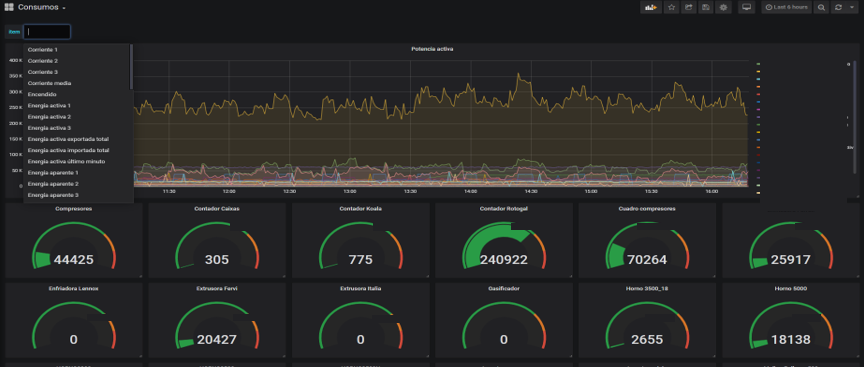
It is possible to monitor devices from different manufacturers in Zabbix, this makes possible to generate dashboards that combine information from all elements in Zabbix, and also in Grafana. The tip is to use a common nomenclature in Zabbix although manufacturers use different names for the variables, this will make it easier to generate dashboards like the one presented. In this way we will create an abstraction layer when analyzing a consumption variable independently of the analyzer device that is being used.
Added value of monitoring energy consumption
We have already included all the consumption data in Zabbix, and now we are able to analyze which areas of my company have a higher consumption, and possible deviations, however we want to get more value from these data. Next we show some possible applications.Production control: operation vs. stop
Monitoring a machine during its operation will allow us in a very simple way to identify when it is on, when it is off and even identify those moments when being on is working or not.
In this graph we can clearly see how there is a first stretch in which the machine was off, then was on but not working, and finally we see 3 peaks where it was on and also working.
These status of the machine are easy to define in new items for this machine, simply defining thresholds: when the current is greater than 0 is on and if the current is greater than 5 is working. At the same time we will be able to obtain other associated KPIs such as machine working hours, efficiencies, etc.
These status of the machine are easy to define in new items for this machine, simply defining thresholds: when the current is greater than 0 is on and if the current is greater than 5 is working. At the same time we will be able to obtain other associated KPIs such as machine working hours, efficiencies, etc.
Production control: cycles and parts produced
Machines usually generate similar patterns of consumption for each cycle of work, so measuring some of the parameters of electrical consumption it is possible to identify parts produced in a machine.
In this example, we can identify how each peak determines a production cycle and therefore a produced part.
The conclusion is that the simple collection of electrical consumption data provides a lot of valuable hidden information for decision making, in Muutech we love to get all the value out of these rough diamonds... monitoring made easy!
Production control: cost per part produced
Bearing in mind that it is possible to count the parts produced and that it can be synchronized with the consumption at each instant of time, then monitoring electricity consumption allows to get the detail of the exact cost per part produced or per manufacturing batch. This is very useful in order to be able to make decisions regarding the selling price and the costs of each reference.Predictive analysis
The analysis of electricity consumption is, together with the analysis of vibrations, one of the most commonly used methods in predictive maintenance. This topic might need a deeper analysis, but only indicate a fact: an engine that spontaneously increases its consumption is a clear indication that it needs maintenance.The conclusion is that the simple collection of electrical consumption data provides a lot of valuable hidden information for decision making, in Muutech we love to get all the value out of these rough diamonds... monitoring made easy!

CTO & TECHNICAL DIRECTOR
Expert in industrial monitoring and data analytics.
We tell you how to improve decision-making and production efficiency in your plant, without wasting time generating reports. Your plant at a glance!
Subscribe to our Newsletter

