

Monitoring your factory: a practical example
May 18, 2020
The importance of data visibility in your factory
June 5, 2021
THE EFFICIENT WAY TO MANAGE YOUR MACHINES
The usefulness of knowing at a glance what is going on
One of the recurring concerns for machinery manufacturers is that their customers are happy with the product they offer. In order to do this, it is essential to efficiently respond to problems and breakdowns that may arise in the machines and, in the best of cases, even anticipate customers' needs.To improve the end user experience, it is very useful to offer a simple and appealing platform that will allow a good control of the machinery, not only alert wise, but performance and cost wise too.
If these requirements are met, the manufacturer will develop a trustful and satisfactory relationship with his customer, with all the advantages that this entails (such as a much-desired customer loyalty, for example).
Keeping all this in mind, we have designed a demo that shows, in a practical way, how we can simply monitor the critical aspects of our machinery. This monitoring will guarantee a good performance, a supply that is always covered and a quick response if any problems may arise.
Our new machine demo consists of two types of control panel. The first one is a dashboard for the manufacturer, with which he can control all the information concerning the different machines and their associated customers. The second type of dashboard is a specific panel for each machine. There, customers will be able to find the relevant information about their machine(s).
Machine Demo: Manufacturer Overview
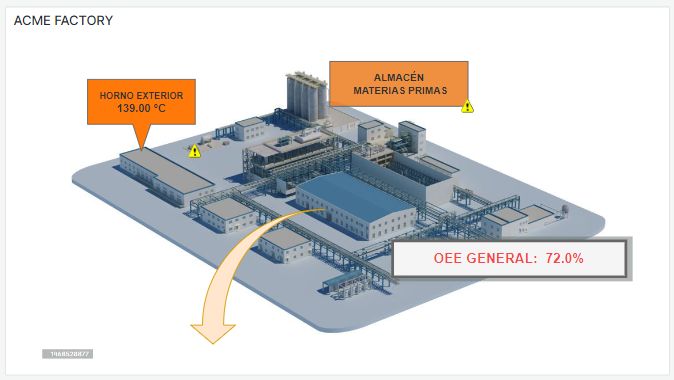
This dashboard displays the information of all the machines and it is the main screen of our demo. Here, the manufacturer is able to check, at a single glance, all the information that is useful for him. This information includes customer machinery performance as well as any warnings or problems that may arise on them.This main dashboard gives us a machine performance overview, displaying alerts and consumption data. Its different elements are:
- Alert map: This interactive map (which can be enlarged or reduced with a mouse scroll) displays all the manufacturer's machines and their geolocation. A colour code indicates whether the machines have any active alerts (red) or not (green). By hovering over the coloured dots we can see the amount of active alerts.

- Machine status: Below the map, we will find the name of each machine on a coloured background, which indicates whether the machine is currently active (green - ON) or inactive (red - OFF). By clicking on these machine “labels”, we may access their specific dashboards.

- Last week’s mean consumption: In this graph we can see the average consumption of the machines during the last week. Hovering over the graph shows specific data for each machine.

- Upcoming supply alarms: In this table, the manufacturer will be able to know beforehand if the time for a machine supply replacement has come. The machines are identified by their number and customer, and the remaining time until supplies are needed is shown. A colour code indicates the urgency (green if there is still much time left, orange and red as the date of needing new supplies approaches).

- Top alarms per machine: This table displays the machine models with more associated alerts, so that we can quickly check which machines are prone to failure.
- Customer warnings: The customer warning table allows the manufacturer to check all the warnings sent by the customers (regarding supplies, maintenance, etc.). The date, customer name and machine number are displayed. A colour code indicates the relevance of these warnings (orange for less urgent and red for urgent).

- Alerts: The alert table shows different alerts launched by the machines when a failure, breakdown or unforeseen event occurs. We can see information about the problem (stopped machine, connection loss, etc.), as well as a colour classification (from green for "Warnings" to red for "High" importance problems). Information regarding date, time and the machine where the alert was triggered is also shown.

- Customer overview: In this table the manufacturer can see his customers and the machines that are associated with them. This table also allows him to know, at a glance, the machines that have worked and produced the most during last week.

Machine Demo: Customer Machine Dashboard
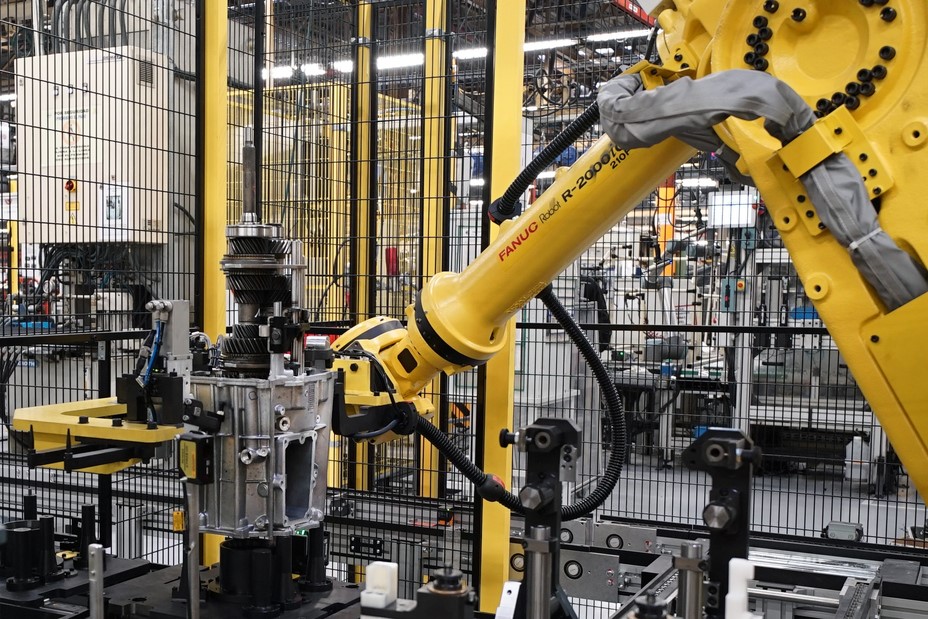
Customer specific dashboards show detailed information for each machine. For our demo, we have designed dashboards for three different types of machines: Robotic Arm, Ball Sorter and Robotic Claw. On each of these dashboards, the user will find all the relevant information concerning his machine (status, critical parameters and alerts) displayed in a simple and pleasant way.Each specific machine includes the following elements:
- Status bar: On the upper left corner there is a label indicating the machine number. This label changes colour depending on the machine status (on - green or off - red). Right below it, we can see a bar displaying the status of the machine over time. By hovering over it, we can see information about the time the machine has spent being on or off.

- Machine information: Next to the status bar we can see the following machine information: version, model, serial number and location. On the right side, there is a picture/diagram of the machine as well.

- Customer warnings and Alerts: As it happens with the overview dashboard, the machine specific dashboard also displays two tables with customer warnings and machine alerts respectively. The difference is that in this case, the warnings and alerts shown are only those belonging to the machine whose dashboard we are on.

- Working hours, consumption and costs: On the right side of the dashboard we can see information about the number of hours the machine has been working, as well as real time consumption data. In addition, you can also see the daily and weekly consumption and cost information.

- MTBF, OEE: Other critical parameters that can be seen on the machine dashboard are the average failure time (MTBF) and the average equipment efficiency (OEE). The current OEE value and its evolution over time are both indicated. A colour code will allow us to know if the current value is good (green), intermediate (orange) or bad (red). .

- Current and active power: Current and active power are two important parameters that are also displayed on the machine specific dashboard. In this case, we have two graphs that show the evolution of current and active power over time. Hovering over each of the graphs, we can see their specific values at each moment.

Customer Machine Dashboard: Stops and warnings via Telegram
The dashboard designed for the "Robotic Arm" type machine includes a very interesting extra. This extra is a form that will allow the customer to stop and restart the robotic arm whenever he wishes. Here is how it works.- Stop machine form: To access the form that allows stopping and starting the robotic arm, you need to press the STOP MACHINE button.

Once this button has been pressed, you will access a menu in which you will find a "Stop" slider and a "SAVE" button (see next picture).
To stop the arm, activate the slider and then press "SAVE". At this point, the robot arm stops, the status of the machine will turn red (Off) and a "STOP BUTTON SELECTED" message will be shown on the Alert table. You can see the changes marked in red in the following image.
To stop the arm, activate the slider and then press "SAVE". At this point, the robot arm stops, the status of the machine will turn red (Off) and a "STOP BUTTON SELECTED" message will be shown on the Alert table. You can see the changes marked in red in the following image.

- Telegram: In addition to this, a Telegram message letting the customer know about the problem (in this case that the stop button has been selected) will also be sent. The message will also include the time and date of the alert, the machine that triggered it and its seriousness. In addition, an advice on how to deal with the problem is given. In this case: To start the robot, press the button again with STOP unchecked.

If we follow the advice and go back to the form, we deactivate the "Stop" slider and then press "SAVE", the robot arm will work again.
When this happens, the status of the machine will turn green again (On), the "STOP BUTTON SELECTED" Alert will automatically be resolved and a new warning will be sent to Telegram, in this case informing the user that the problem has been solved.
When this happens, the status of the machine will turn green again (On), the "STOP BUTTON SELECTED" Alert will automatically be resolved and a new warning will be sent to Telegram, in this case informing the user that the problem has been solved.

In Summary
What we wanted to do with this demo is to show you how it is possible to control several machines belonging to different customers without going crazy. We hope that we have succeeded and that you have enjoyed our guided tour.Finally, we would like to say that this demo is just one example of how things could be done. In fact, our Minerva platform allows us to display almost any type of data on our dashboards, depending on what is needed. The same goes for alerts, mobile warnings and even the aesthetic aspect. All of them are widely customisable depending on the taste and needs of the manufacturer/customer.
Now you know... we can design the ideal dashboard for you and your customers, you just have to ask!

CTO & TECHNICAL DIRECTOR
Expert in industrial monitoring and data analytics.
We tell you how to improve decision-making and production efficiency in your plant, without wasting time generating reports. Your plant at a glance!
Subscribe to our Newsletter
