We help companies fight downtime and degradation of IT systems and industrial processes.

Transform your monitoring data into valuable information, anytime, anywhere

Monitoring of

All in one!

Monitoring Experts

At Muutech Monitoring Solutions we offer monitoring solutions focused on information systems, industrial and production environments.

Our monitoring platform Minerva, is based on Zabbix and Grafana, which collects and displays data from multiple sources.

Industrial Monitoring

We help companies to understand and control their production processes from a single, centralised interface.

Start to collect data on your production processes and industrial machinery within minutes, whether they are connected to the network or not, regardless of the manufacturer or the location of the machines.

Network, Communications and System Monitoring

We help you monitor your network equipment, communications and systems.

Solutions for any type of infrastructure, services, applications and computer resources.

Get the most out of your systems and stay ahead of trouble!

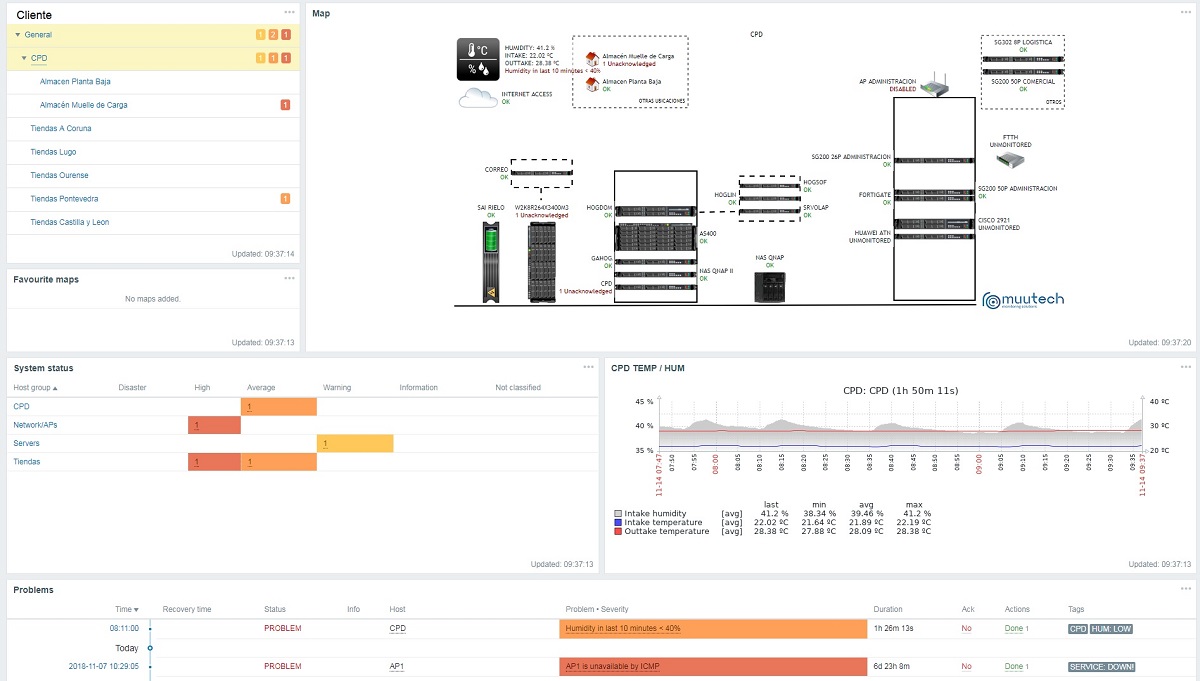
Muutech has presented us with a platform that allows us to control and analyze processes in a fast, simple and very visual way. With it we can anticipate possible incidents of the monitored systems, reducing considerably the time of resolution of the same.

Juan Vilas

IT Systems Manager at Hogarlín S.A.

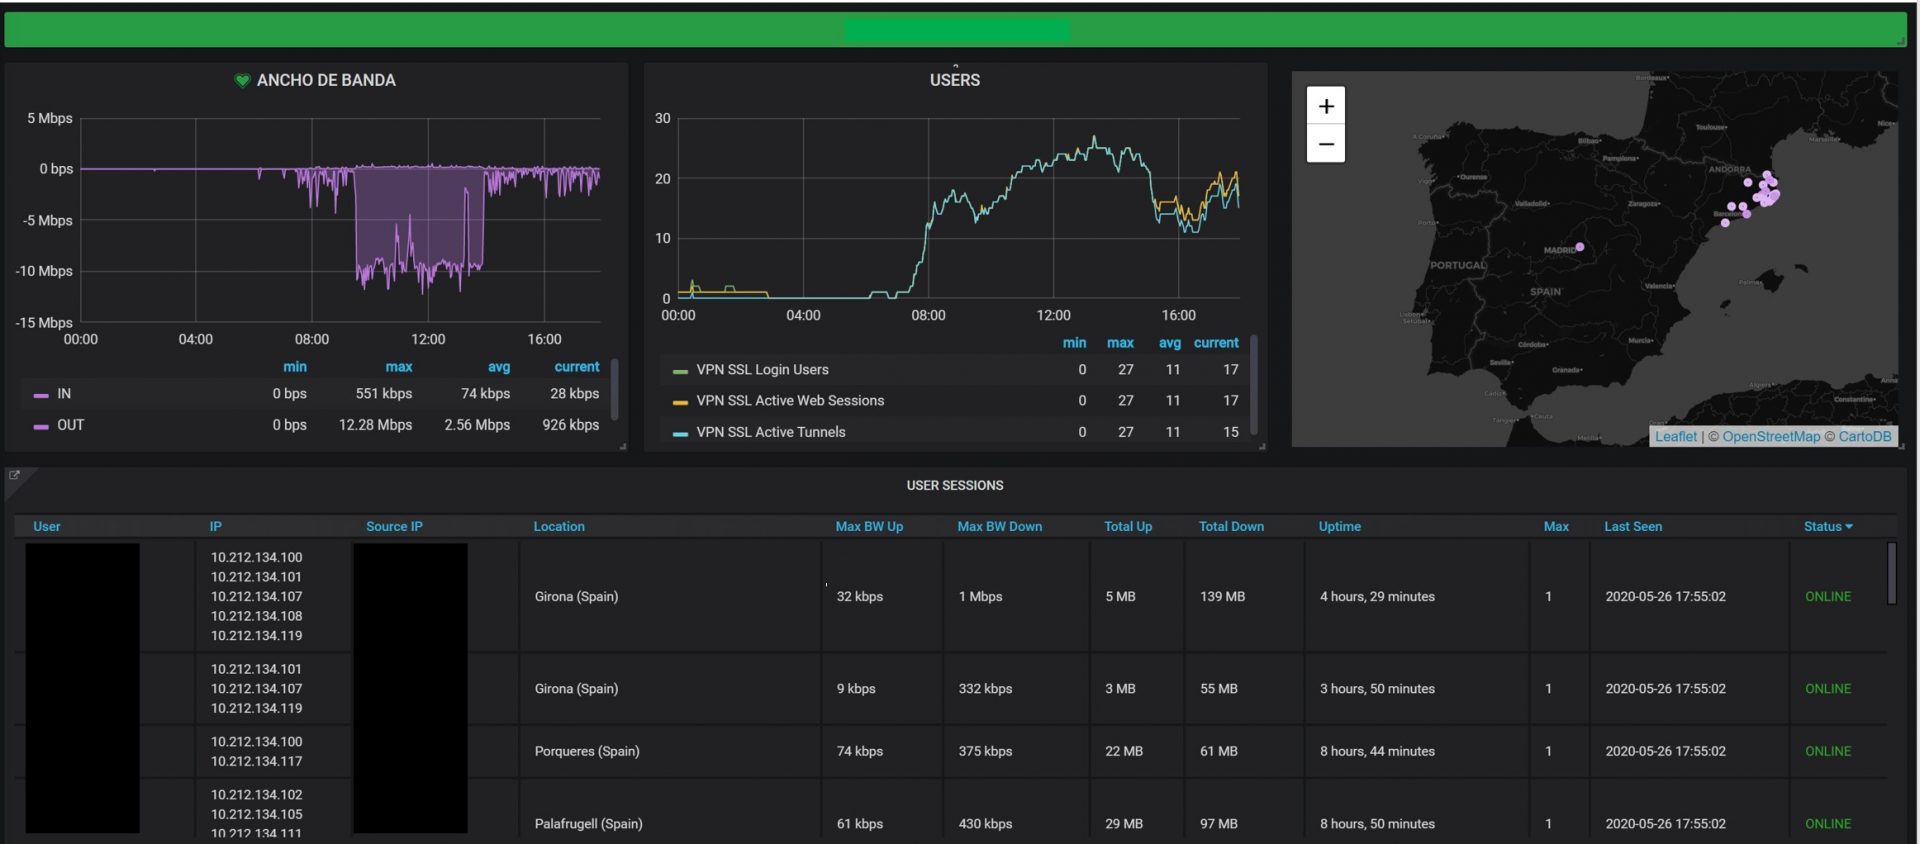
The tool has provided us with visibility to remote stations that previously remained unseen when dealing with service incidents. This has improved our ability to diagnose and solve problems, which has translated into a better user experience for our customers.

Carlos Derqui

CEO at Syntelix

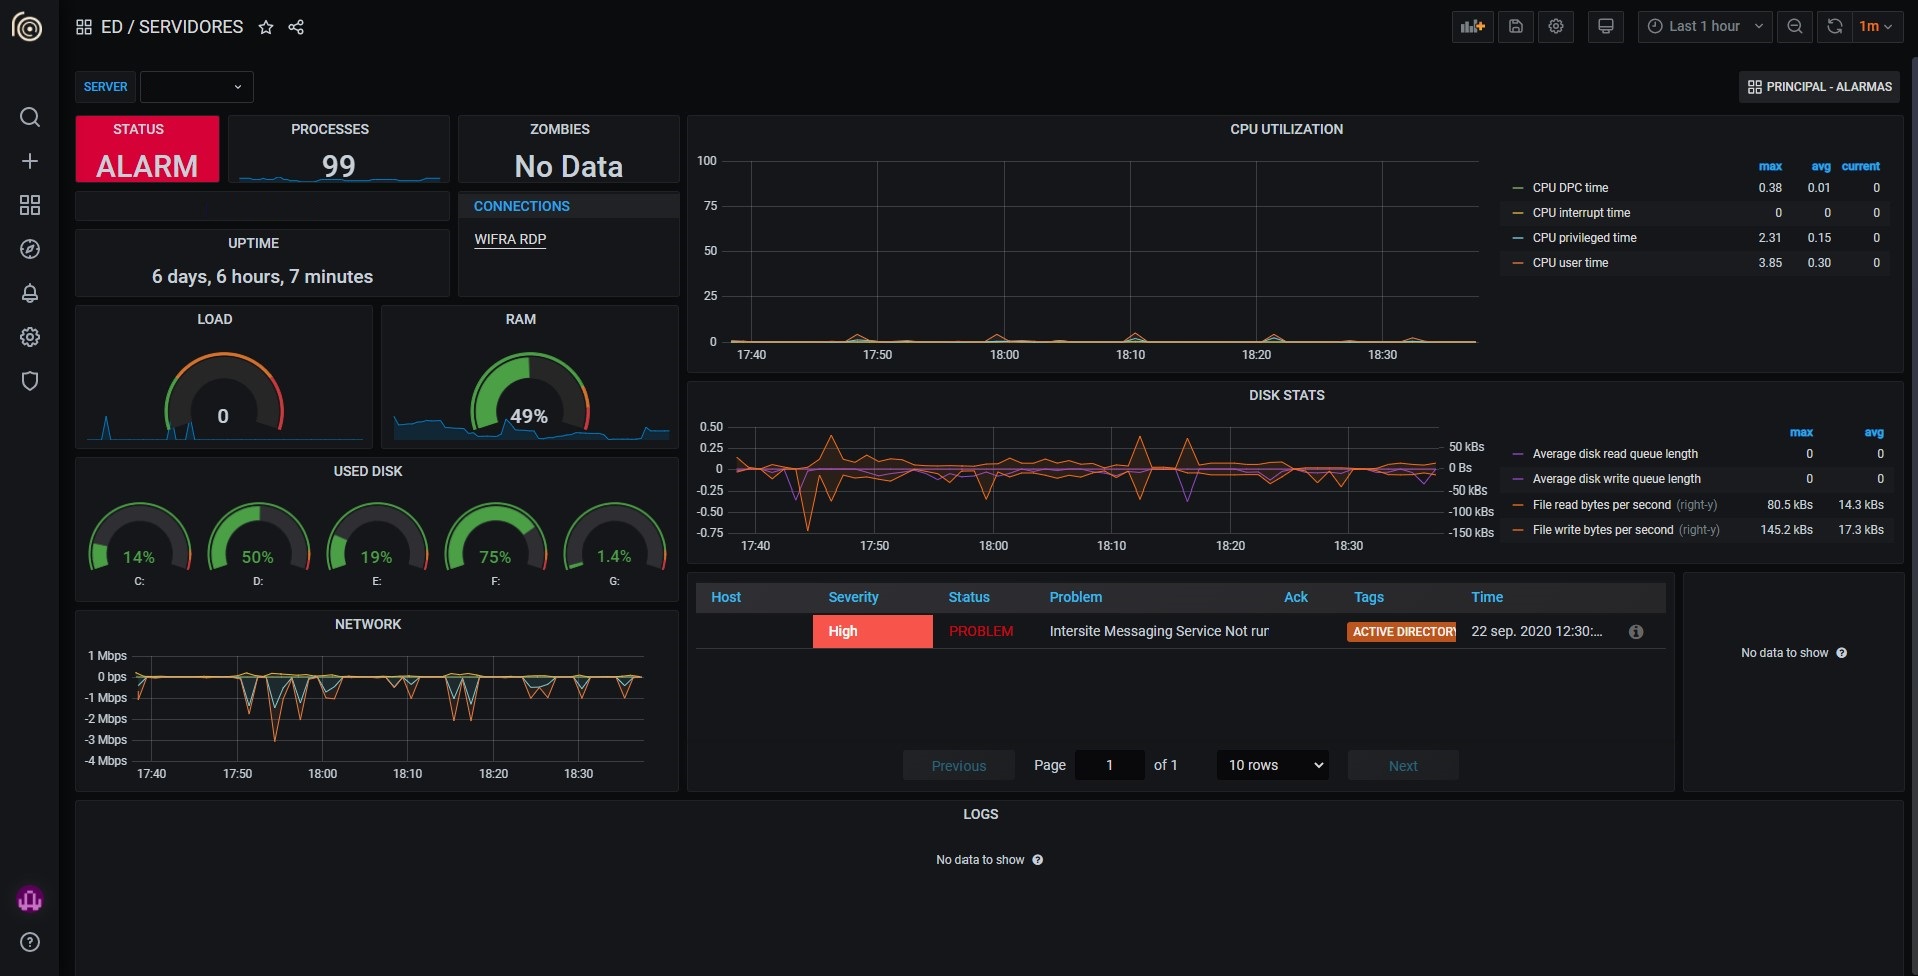
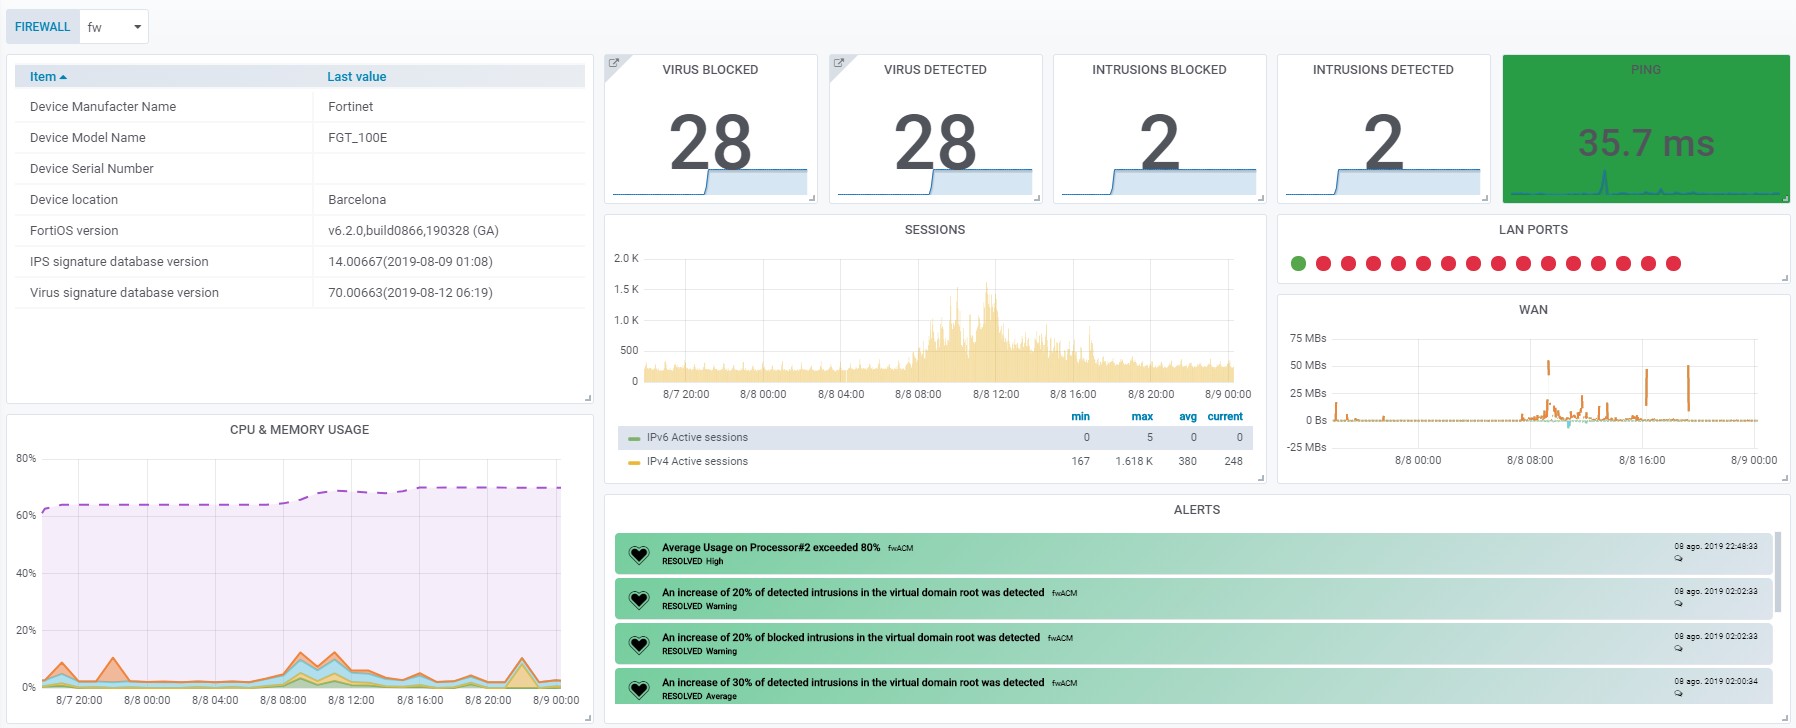
The platform allows me to see the IT network and hardware infrastructure, detecting problems in real time through the dashboards, and connecting directly to the computers as soon as any alarm is triggered, saving me a lot of time in detecting and solving problems in the company's computers.

Iago Fernández

ICT Manager at Viña Costeira
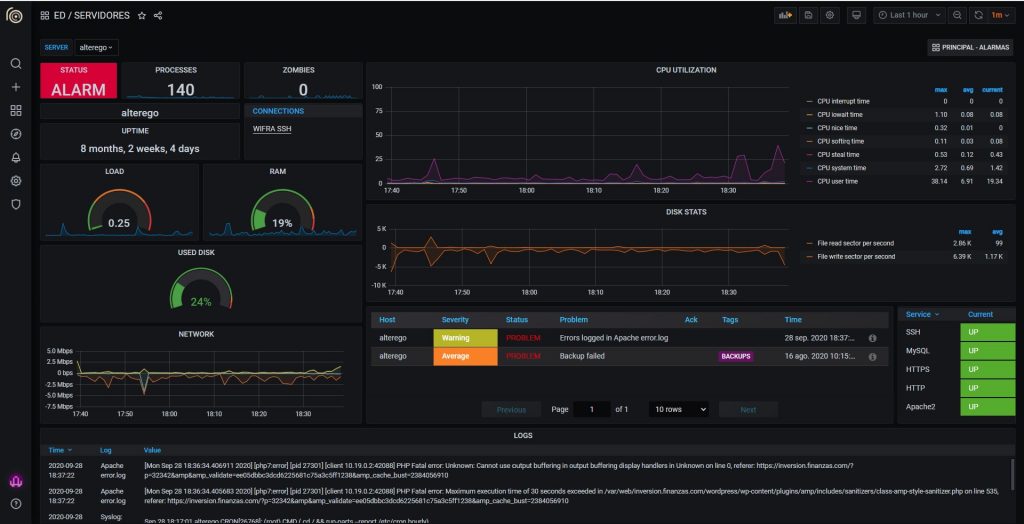
Minerva is our enterprise-grade monitoring platform based on Zabbix and Grafana

Controls

Monitor, control and manage all systems, devices, traffic and applications in your network and communications infrastructure.

Visualizes

Collects information from any information source (servers, routers, switches, UPS, APs, databases, ...) and displays it on custom dashboards.

Informs

Alarms designed to your needs. Predicts and corrects incidents before they occur.

Service

We include a complete monitoring services, good practices, maintenance, updates, etc.

Integrated Technologies

Minerva is mainly based on open source technologies such as Zabbix and Grafana. Monitor your entire IT infrastructure. It supports all major technologies:

  • Zabbix Agent
  • SNMP: ready-to-use with custom options
  • Windows and WMI performance counters
  • SSH: for Linux/Unix and MacOS systems
  • HTTP y HTTPS requests
  • API REST that returns XML or JSON
  • Ping, SQL and more
  • Zabbix infraestructure

    Maps and Dashboards​

    Identify your entire network using autodiscovery techniques and visualize it through real-time maps and dashboards with dynamic, value-added information.

    Access the configuration of your equipment from the control panel itself in one click, through WIFRA or through integrations with Anydesk or Teamviewer.

    Flexible, Predictive Alerts

    Minerva will alert you to a problem when it discovers unusual drifts or metrics.

    Minerva has multiple built-in reporting mechanisms, such as e-mail, slack, Whatsapp, push notifications, or HTTP requests. You’ll receive notifications directly on your phone, whenever you need them.

    The system is easily customizable and provides alerts, notifications, and scheduling. Avoid receiving hundreds of similar and unnecessary messages by using intelligent dependencies and alarms.

    Dashboard Zabbix

    Integrations

    Minerva allows the integration with following elements:

  • Integration with Ansible.
  • Ticketing tools: Redmine, JIRA, GLPI, ServiceNow.
  • Notificación tools: Slack, Telegram, Microsoft Teams, Twitter, PagerDuty.
  • Datacenter Monitoring

    Control of the state of the communications equipment in your machine room, thanks to the active monitoring of the temperature and humidity of your Datacenter.

    Your Zabbix and Grafana monitoring system always ready

    We integrate, maintain and update your Zabbix and Grafana monitoring system.

    Templates generation, alarms optimization, training, consulting and much more.

    We work with the best technologies on the market

    Zabbix

    Zabbix

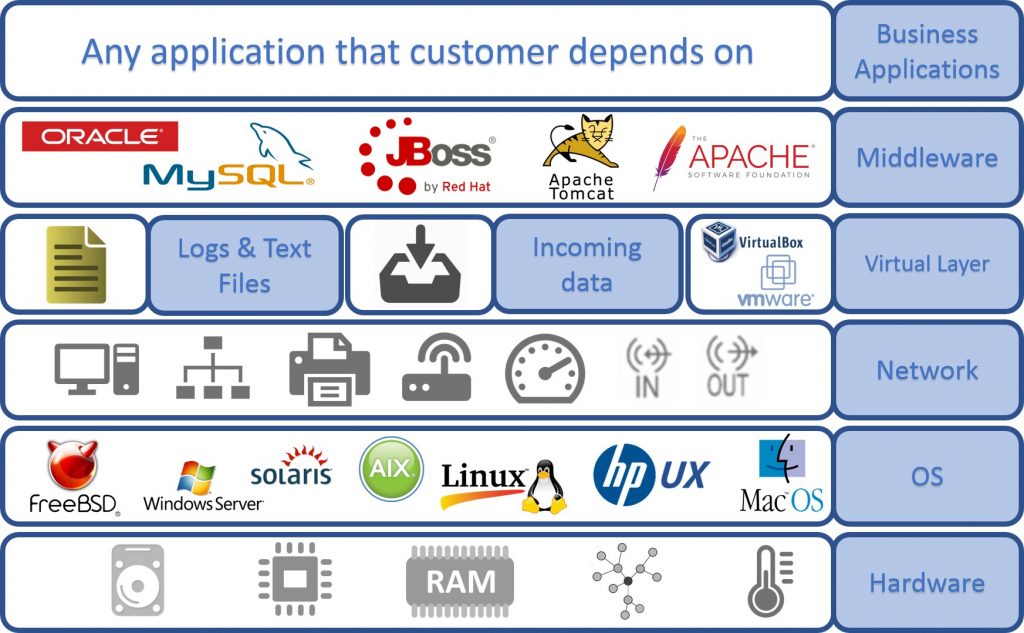
    It is a system for monitoring the capacity, performance and availability of servers, equipment, applications and databases, among others. It also offers advanced monitoring, alerting and visualization features that even some of the best commercial applications of this type do not offer.

    Grafana

    Grafana

    It is a tool for consulting and visualizing data series in a more aesthetic and stylish way. It is a very powerful tool, with a very elaborate query editor that allows you to choose from the metrics you have recorded and to perform all the treatment you need with them.

    Convinced? Contact us!