IT and Network Monitoring

We help you to monitor your network equipment, communications and systems

Get the most out of your systems and stay one step ahead of problems!

Minerva is our enterprise-grade
monitoring platform based on Zabbix and Grafana

Controls

Monitor, control and manage all systems, devices, traffic and applications in your network and communications infrastructure.

Visualizes

Collects information from any information source (servers, routers, switches, UPS, APs, databases, ...) and displays it on custom dashboards.

Informs

Alarms designed to your needs. Predicts and corrects incidents before they occur.

Our customers already enjoy system monitoring

Monitorización en empresa del sector distribución

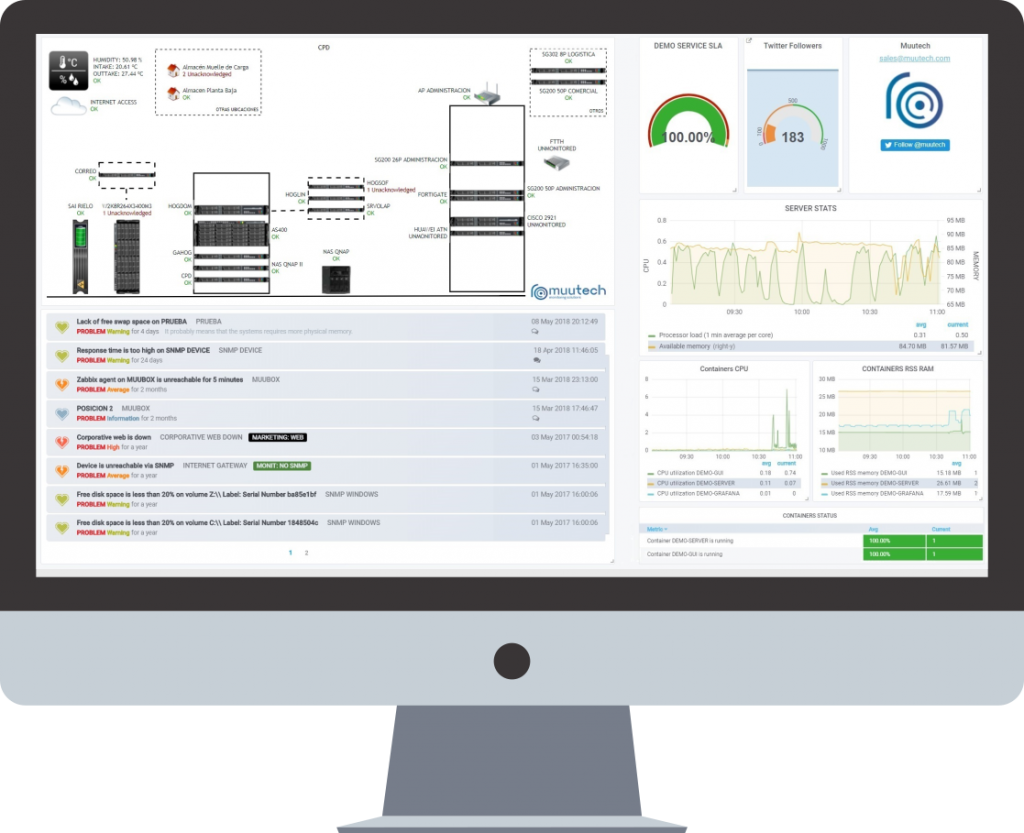
Server and Warehouse monitoring in a company from the retail industry

The IT Infrastructure monitoring project is carried out for Hogarlín S.A., a company of more than 200 workers, of the Sociedad de Inversiones Vegon S.A. Group, whose activity is based on the distribution and sale of drugstore products, perfumery and articles of Cleaning, both through its own network of shops (Muchas) and through franchises (Chévere) and its sales network...

Muutech has presented us with a platform that allows us to control and analyze processes in a fast, simple and very visual way. With it we can anticipate possible incidents of the monitored systems, reducing considerably the time of resolution of the same.

Juan Vilas

IT Systems Manager at Hogarlín S.A.

Syntelix-use-case

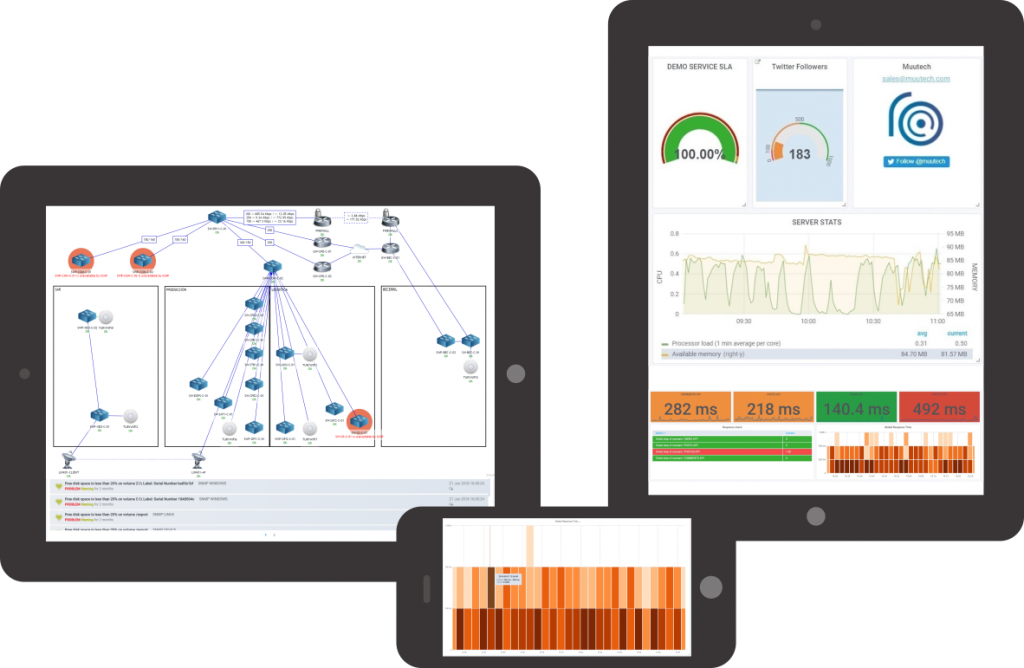
Monitoring of satellite communications infrastructure focused on vessels

When we contacted Syntelix, a company specialized in land and sea satellite communication solutions, they had a problem: they had several heterogeneous monitoring solutions with their different satellite networks, based on old technologies, but they did not solve the problem they had: being able to measure and monitor in real time and in a unified way the use their customers made of their technology.

The tool has provided us with visibility to remote stations that previously remained unseen when dealing with service incidents. This has improved our ability to diagnose and solve problems, which has translated into a better user experience for our customers.

Carlos Derqui

CEO at Syntelix

Monitor Anything

Solutions for any type of infrastructure, services, applications and computer resources

zbx

Network Elements

Multi-vendor network element monitoring. Network health, performance monitoring, configuration changes

zbx

Servers

Server monitoring, performance, availability (high availability), CPU usage, RAM, etc. Windows, Linux, Solaris, AS400 servers...

zbx

Cloud Services

Monitoring of cloud services such as Amazon Web Services (AWS), Google Cloud or Microsoft Azure

zbx

Web Monitoring

Monitoring of servers and web protocols: Apache, NGINX, SMTP, HTTP, HTTPS, etc.
Monitoring of web services and web pages: access time, authentication, etc.

zbx

Aplications

Monitoring of API status, response times, exposure of internal application metrics, etc.

zbx

Services

Service-oriented monitoring. Just because a server goes down doesn't mean that the service is down, it measures the availability of your services as perceived by the users.

zbx

Virtual Machines

Monitoring of virtual machines on VMWare, Citrix, Hyper-V, etc.

zbx

Databases

Database performance monitoring and queries on MySQL, PostgreSQL, Microsoft SQL Server, Oracle or MongoDB databases

zbx

Security

Monitoring of security elements: failed logins, antivirus status, alerts, backups, ...

Monitoring of firewalls (alerts, VPN status, connections, etc.) of Fortinet, WatchGuard, F5 Networks, BlueCoat, etc.

zbx

JAVA

Monitoring of Java applications through JMX, JBoss, Apache Tomcat, Glassfish, Websphere

zbx

Service SLA

Save time in understanding, monitoring and enforcing service level agreements. Automatic control and reporting of your SLAs.

New Technologies

Integration of new technologies: OpenStack, Docker, Kubernetes, etc.

Main Features

Your systems and applications, at a glance

All your IT, application and telecommunication data, from any location and device, in real time.

Muutech’s monitoring platform helps you taking the right decisions. We will support you to reduce and eliminate system stoppages and inefficiencies.

Through dynamic customized dashboards we help you to know at any time the status of your information systems. Anticipate problems before they occur.

Dashboard IT

We integrate with your systems

Through our open source agent Zabbix or through an API, we collect metrics at system level, and display them through your tool’s control panel .

Monitoring simplifies massively your set of tools for collecting system-level metrics in one place. Through your tool’s control panel, you can view and manage charts, track system performance, and set up instant alarms.

Real-time data collection

The Muutech solution based on Zabbix adds a powerful device capable of displaying in real time different characteristics of systems, communications protocols and IT applications. Some examples of basic network element monitoring could be:

– Memory usage
– System load
– Health of the discs
– Temperature
– Network usase

Muutech it at a glance

Data correlation and alert generation

Create, modify and manage intelligent alerts that facilitate the monitoring of changes in the system, from the application control panel.

Alerts and notifications will be received whenever a metric crosses the specified threshold or critical problems arise. We offer the possibility to receive instant notifications when a new alert is activated, through mail, via SMS on your mobile device, etc.

Your Zabbix and Grafana monitoring system always ready

We integrate, maintain and update your Zabbix and Grafana monitoring system.

Templates generation, alarms optimization, training, consulting and much more.

We work with the best technologies on the market

Zabbix

Zabbix

It is a system for monitoring the capacity, performance and availability of servers, equipment, applications and databases, among others. It also offers advanced monitoring, alerting and visualization features that even some of the best commercial applications of this type do not offer.
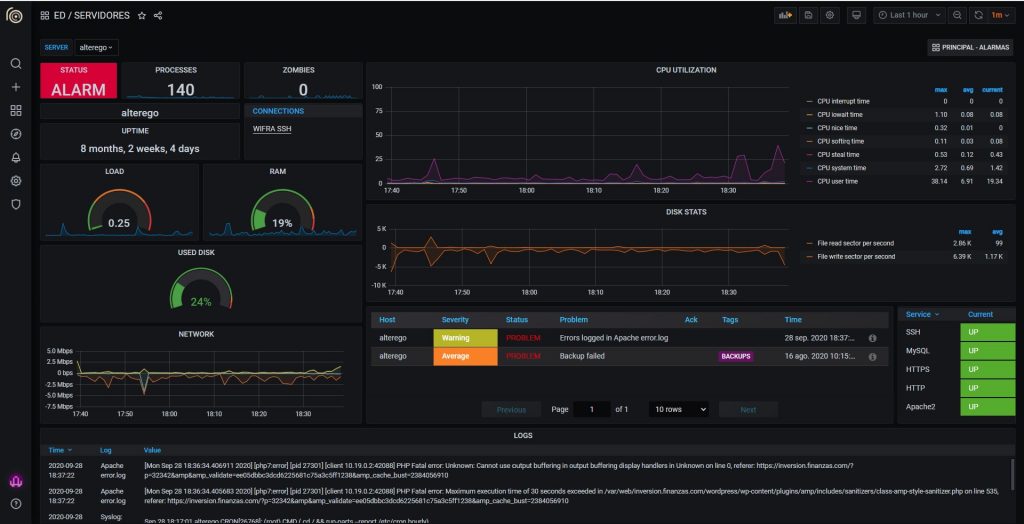
Grafana

Grafana

It is a tool for consulting and visualizing data series in a more aesthetic and stylish way. It is a very powerful tool, with a very elaborate query editor that allows you to choose from the metrics you have recorded and to perform all the treatment you need with them.

Convinced? Request a customized demo!​