NISSAN POWERTRAIN CASE STUDY
November 5, 2021
The best Grafana plugins for the Industry
Industrial Grafana: the visualization tool for the industry
Grafana is a very powerful and very flexible visualization tool, but it seems to be something that we in the industry forget. It is true that it is a solution more used in fields such as IT and IoT (Internet of Things), but we want to help you get the greatest potential out of it for the Industry.
Today we bring you a list of the plugins and panels that we consider the most useful for an industrial dashboard. In this case, we are going to focus on the new version of Grafana 10, which we have just added to our demo
The basics of Grafana for Industry:
This block includes a set of basic Grafana plugins, that are very interesting to use in the industry, and if we want to highlight one: “Discrete” and its replacement “State timeline”
- Discrete: one of the most interesting options for the industry, it permit us to show the states of a machine, line states, changes in Production Orders, breakdowns, etc. Basically it is a timeline that allows us to define states, each with its own colors. Without a doubt a mandatory plugin. Although it is true that until now Discrete was widely used, it is currently being replaced by State Timeline.

- State timeline: it is the substitute for Discrete, and it allows us to do something even more interesting, which is having several rows on the same time axis (something very useful for comparing machines or lines).

- Stat: it is one of the basic Grafana plugins, and very useful for the industry. Basically it is a panel that allows us to show data, something very visual, and that allows us to introduce colors depending on the configured thresholds. So showing an OEE and a color code according to the state can be very interesting.

In addition, the Stat plugin allows us to add a small graph next to the data (sparkline) to see the trend

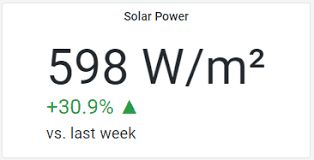
- Percentage Trend: it is practically the same as Stat, but it allows us to add a comparison in percentage (thus showing the trend). Here we can see an example where the percentage of improvement is clearly seen.
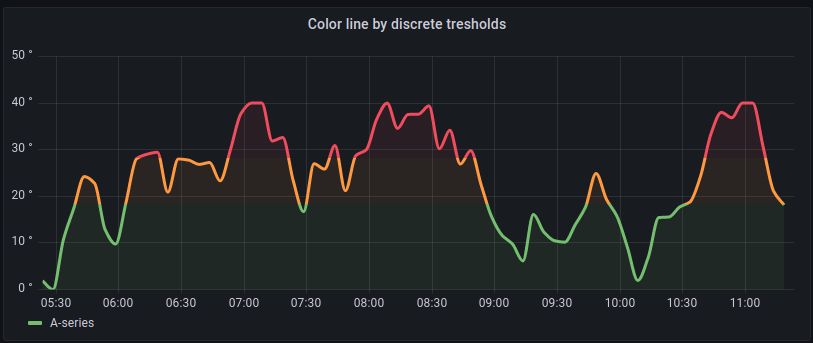
- Time series: a very useful plugin to display graphs of any type (bars, lines, points), it gives us many possibilities
- Bar chart: but if we want something with more potential for bar charts, without a doubt this Bar Chart plugin, it is very interesting, and we recommend it for the industry. One of the most useful extra features is that it allows us to group several bars. In this example we can compare production hours and daily electricity consumption:

The most artistic for the Industry:
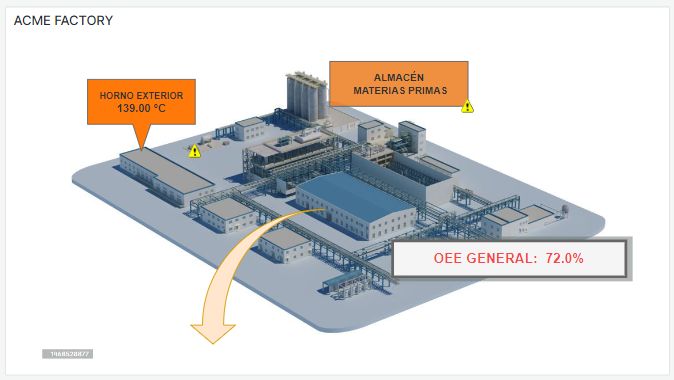
The FlowCharting plugin and its replacement Canvas are probably the best type of plugin to be able to display diagrams, drawings, etc. and have the data wherever you want. Basically it allows us to use a drawing tool such as draw.io, which can also be configured to display dynamic data. This will allow us to make almost everything, from “scada” type drawings to floor layouts, elevations, diagrams and anything we can think of. They are very powerful plugins for our industrial Grafana.

- FlowCharting: it is based on creating a drawing or diagram with draw.io, you just have to later indicate which elements of the diagram are going to depend on a variable/data and it simply integrates and updates them in real time.

So, for example, for the layout of the image, it is enough to configure the plugin and indicate a mapping of the variables that you want to be displayed.

- Canvas: currently FlowCharting is becoming obsolete and its natural replacement is Canvas, which provides us with the same format and possibilities.
The most versatile:
And if we want to go one step further in terms of customization and adaptation (something that is sometimes necessary in the Industry), we show you these 2 plugins that, although they are complex, will allow us to do practically what we want.
- Echarts: without a doubt one of the most powerful plugins that we can use in our industrial Grafana. Based on Apache ECharts, it requires “coding” the graph and options you want to use, but the possibilities are endless:
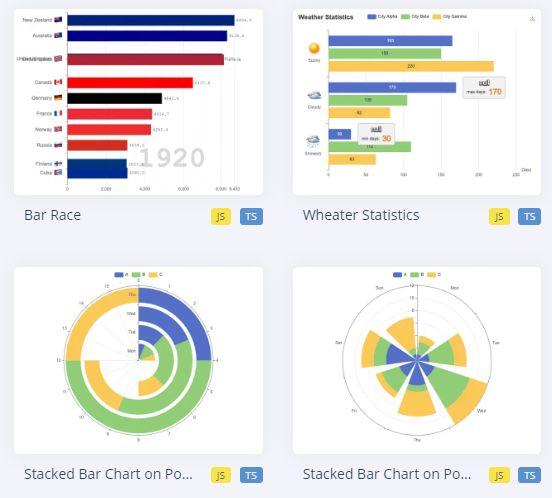
- Html Graphics: another option that we recommend exploring for those people who want to go one step further. A plugin that allows us to incorporate Grafana metrics into the HTML code we create.
The least interesting:
Just as we have recommended several of the plugins that we see as most interesting to use in Grafana for the industry, we also have to point out those that we believe are not very useful. Mainly, these plugins usually take up a lot of space to show little information and are not usually very representative.
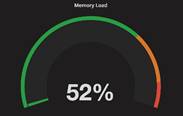
- Gauge: it is usually a speedometer, but due to the type of metrics used in the industry, it usually uses a lot of dashboard space and does not provide much information. There are definitely better options.
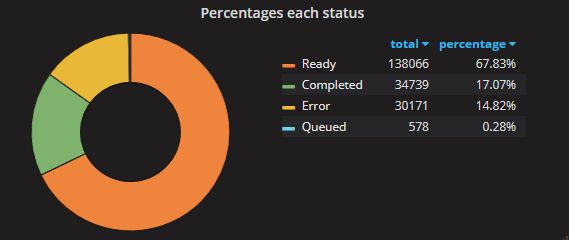
- Pie Chart: another plugin, which in our opinion takes up a lot, and provides not too much. In some cases it may be useful, but we do not recommend its use.
Other useful Grafana plugins for the industry:
These plugins are other options that in a specific scenario can be very useful: maps, cells. In our case we have used them for machinery manufacturers, where there are multiple locations and multiple machines that we want to add.
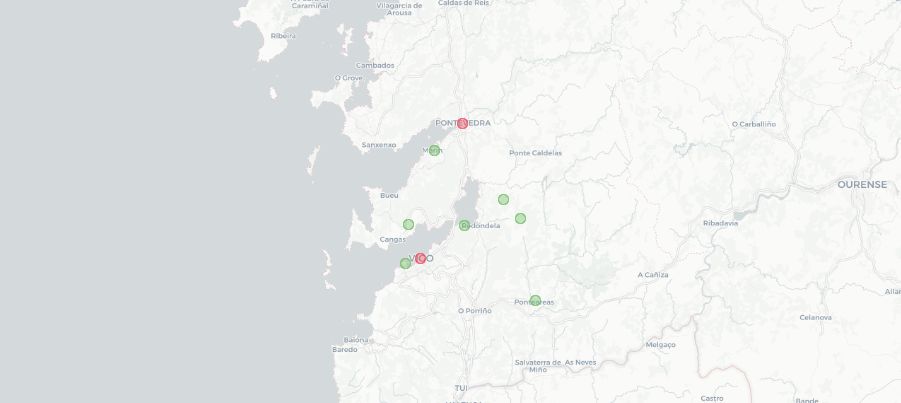
- Geomap: useful to be able to show maps with metrics. For example, the status of my clients’ machines
- Polystat: cell plugin, which can be used to show the machines and their status in a grouped way
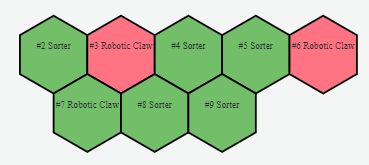
And if you want to try these plugins and others, don’t forget to visit our demo:

CTO & TECHNICAL DIRECTOR
Expert in industrial monitoring and data analytics.
We tell you how to improve decision-making and production efficiency in your plant, without wasting time generating reports. Your plant at a glance!
Subscribe to our Newsletter

