The efficient way to manage your machines
December 1, 2020
NISSAN POWERTRAIN CASE STUDY
November 5, 2021

THE IMPORTANCE OF DATA VISIBILITY IN YOUR FACTORY
How industrial data is handled today
Whether we are in an automotive or food plant, we will find that data is already given an important relevance for decision making. This has been boosted thanks to the progressive implementation of new and more modern technologies in the different components involved in the production process: machines connected to databases compiling historical data, traceability through MES/ERP systems, etc.This type of tools collect data and display them in a more or less predetermined way, or through a reporting module that requires certain customized developments and the truth is that this has meant a before and after for the future of many companies... but what happens when we want to correlate data from different systems, include data from other platforms, data reported by operators, or simply want to display the data in a way that is easier to interpret? Well, we turn to our old and valuable friend: spreadsheets. Call it Excel, Calc or Google Sheet..
The truth is that it is an agile and extremely flexible tool and we usually get a lot of value in the first iterations: a simple graph with production grouped by months, etc. and it will be easy to maintain as long as we don't need to grow much more. At Muutech ourselves, we use Excel to manage some simple things. What's the problem? It is very easy to want to add more and more graphs, data and calculations, especially when teaching colleagues, bosses, etc. And why don't we add an additional sheet where I paste the data I export from SAP or MES every day? And with a VLOOKUP, everything is magically imported!
The problems start to appear then:
- The more rows and sheets you import, the longer it takes to perform the calculations... on more than one occasion the software crashes.
- Adding a new column becomes hell.
- Suddenly other colleagues and departments start using your Excel: if you go on vacation or have a difficult day, they are so dependent on you that you have become the company's Excel "guru".
- To these colleagues or bosses you have to send every day by email the report and some of them even print it (wasn't the idea of this to avoid paper?) ... and it takes up more and more, saturating your mail and making you waste time every day first thing in the morning that you could be devoting to other tasks of greater value (or simply of value, since you suspect that they only look at what you send them from time to time, or only when there are problems).
The result for the company:
- You (and probably your colleagues who have decided to follow suit and version or make their own spreadsheets), a valuable resource to the company, spend 1-2 hours a day on this task.
- This leads to too many "sources of truth", too many reports, stored in email or printed on paper without date, making them difficult to manage and leading to the cost of making data-driven decisions becoming increasingly high, potentially exceeding the cost of doing it on paper.
- A solution has become a new problem, since the fact that everyone works with different Excels causes loss of time, discussions, errors when changing a piece of data ("but I only added one column", "didn't it automatically read all the rows?"). And if you start to doubt the veracity of a piece of data, it is automatically invalidated for decision making.

There is another way to do it: DIGITALIZATION (but for real).
Summarizing, we encounter the following problems:- Cost in time for the elaboration of Excels due to their processing, compilation, copy and paste of CSVs from different platforms, changes in structure, etc.
- Poor data reliability, due to the sensitivity of the spreadsheets and the fact that they are not designed to automatically adapt to data growth.
- Difficulty in sharing data or visualizations, since it is a file. Moreover, we do not know to whom this file can reach. Impossible to put it on a screen in real time.
In each of these problems, technology is our ally:
- The process of collecting, pre-processing and storing the data can be automated. Good!
- By storing the data in a DATABASE, it is designed to grow and adapt with new and more data. Thanks to this storage and to the pre-processing or post-processing (ETL or ELT technologies) it is also possible to check the veracity of the data: if they are numbers, if they are in certain values, if a field exists in the supplier table, etc. giving RELIABILITY to the data.
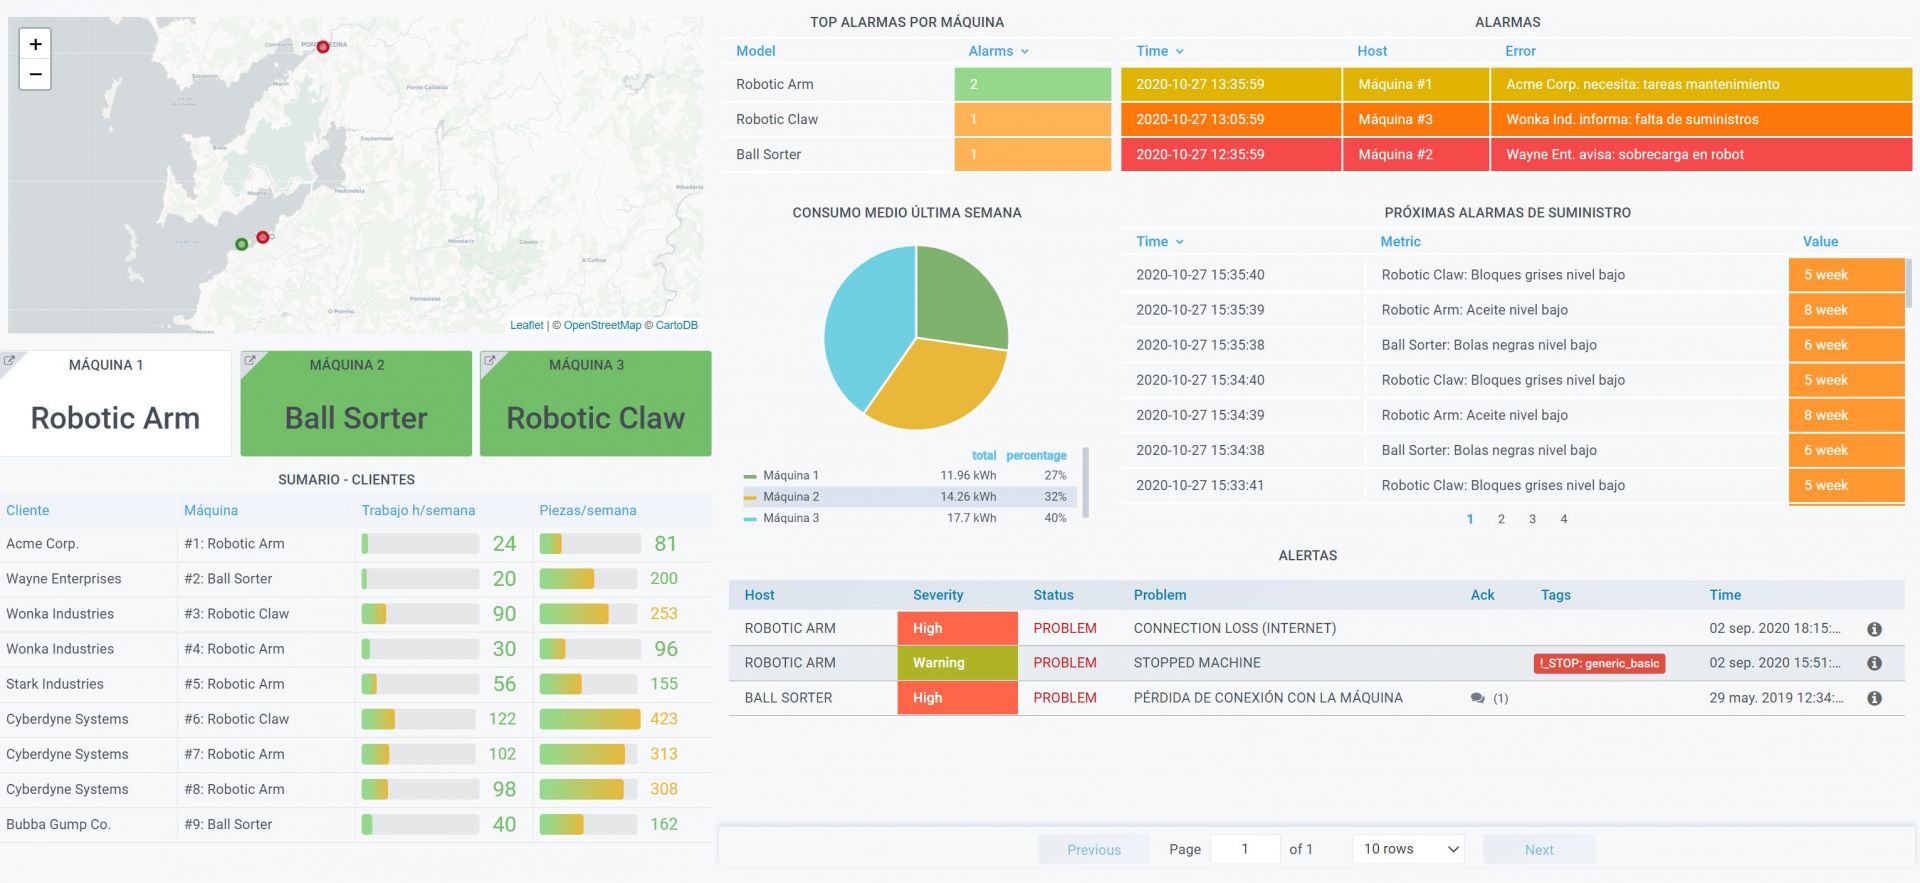
- The data can be shared with a link, to see an interactive dashboard through a web page, without the need to download anything, read any manual, etc. So, you can put it on a TV screen, pass it through a chat, email... or a QR. Publicly for whoever has the link or through a specific login, with the necessary security and confidentiality guarantees: Enterprise-grade data visualization and analysis.
Therefore, we need one or more tools that have the following elements:
- A system that allows to collect data from any source (industrial, sensors, manual through forms, from information systems, etc.) in the most automated way possible and store them in a database.
- A system that allows pre and post processing of this data (ETL/ELT).
- A system that allows analytics of these data, continuously monitoring them and triggering alarms and automatic actions to help us make decisions and anticipate problems.
- A system that allows easy visualization and exploration of these data, that allows controlling access to them, but also facilitates their sharing through links, putting them on giant screens, automatic periodic sending of reports, etc. It is important that it is very flexible and highly customizable, avoiding products with all the reporting included.

Once the technology has been implemented, bring it closer to the people and see the results.
It is not necessary to implement all of these elements at once, but rather you can go little by little and see the benefits of each one:- Automating data collection from any source means savings of 25% in what is called "surveillance time": this is the time spent by operators writing down in notebooks, passing to excels data from machines, sensors, etc. and managers creating and managing the spreadsheets that bring together this data, downloading CSVs from other platforms, launching queries to the ERP, etc.
- Having automated analysis and alarms to help anticipate problems and reduce their impact can lead to improvements of 5-10% in the availability of production lines.
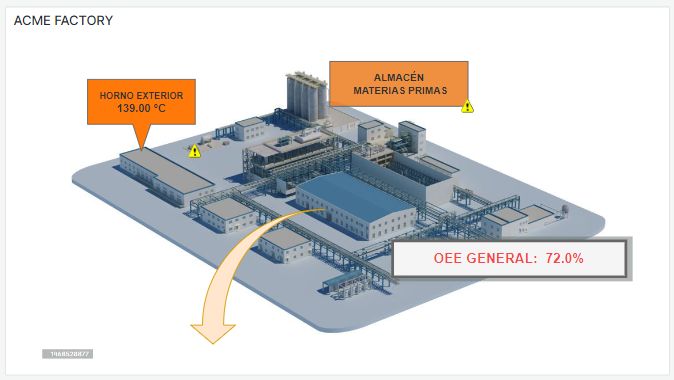
- Bringing real-time data to the operators, through screens where they can easily see (red, green) how their own work is going and have alarms before any problem, can increase up to 20% the availability and capacity of the production lines. Why? Because many times the person who can solve a problem faster is the one who is at the foot of the line, who also feels the responsibility as his own (he is "empowered" as they say nowadays). Let's think that in many companies whose problems are detected in Excel the next day, whether it is a quality problem, a machine problem or simply that the operator has not kept up with the expected pace. This is also an exercise in transparency towards operators, and also prevents workers from thinking that a monitoring tool is to control them, on the contrary, it is to improve together.
With all this, we see that the benefits are clear and not ethereal, but arise from concrete improvements based on two specific points:
- Saving time by allowing to dedicate time to more important things for production, through automation (Lean).
- Reduction of reaction times and sharing of responsibilities through direct, simple and real time feedback to the plant. Bringing problems closer to the person closest and most capable of solving them in the shortest time. This reduces the impact of the same and avoids them in many occasions.
As an example: one of our customers has managed to save the time of an operator (not ONE operator) only in the part of data collection, avoiding those wasted time and achieving a result that before was a utopia to do it by hand: having their plant at a glance, in real time, accessible to all.


CTO & TECHNICAL DIRECTOR
Expert in industrial monitoring and data analytics.
We tell you how to improve decision-making and production efficiency in your plant, without wasting time generating reports. Your plant at a glance!
Subscribe to our Newsletter


