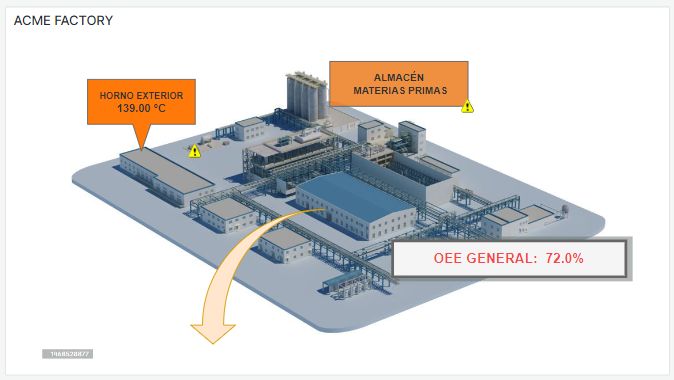
Getting all the potential of monitoring electricity consumption.
July 30, 2019
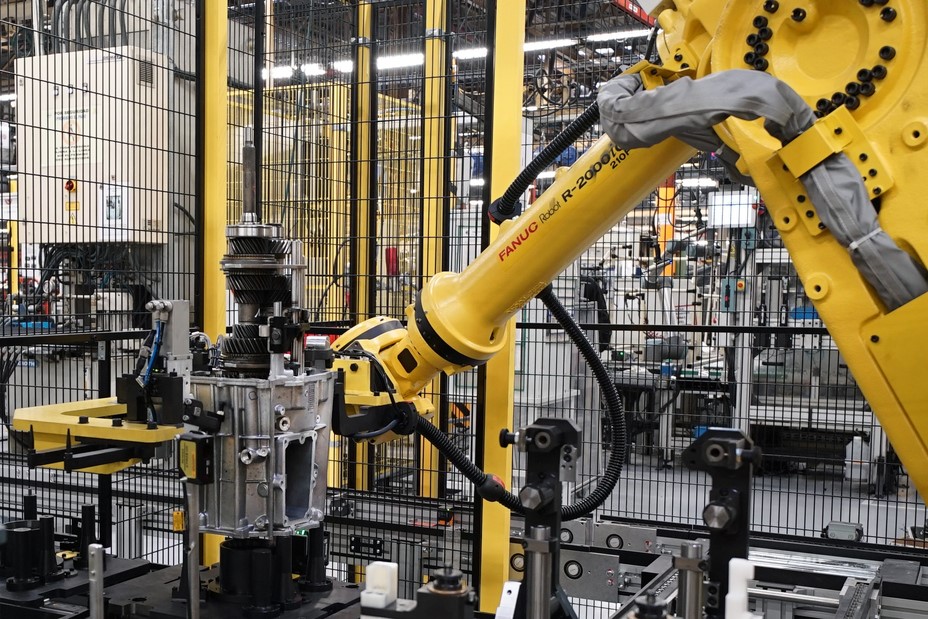
Comparison MQTT vs OPC-UA
August 20, 2019

Dashboards are for the summer.
In summer it is very common that there is less availability of the company's technical staff for holidays, summertime, etc. but our business does not stop because of this.
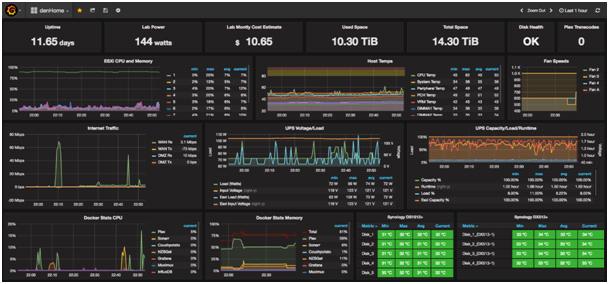
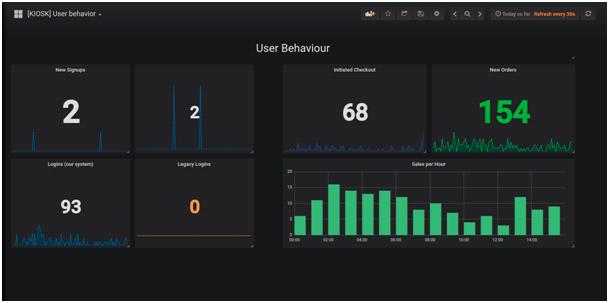
Technical staff being out or hard to contact can be a problem if no one in the company is able to interpret a dashboard like the one in the photo: Is everything okay? Should we be worried about those spikes in the middle graph? Both for the manager or person in charge and for the technician himself, it is preferable to avoid these doubts... which usually end with a call from the office to the beach. If you thought that this article was about how to design dashboards optimized to avoid the reflection of the sun, it will be for another time.
Technical staff being out or hard to contact can be a problem if no one in the company is able to interpret a dashboard like the one in the photo: Is everything okay? Should we be worried about those spikes in the middle graph? Both for the manager or person in charge and for the technician himself, it is preferable to avoid these doubts... which usually end with a call from the office to the beach. If you thought that this article was about how to design dashboards optimized to avoid the reflection of the sun, it will be for another time.
There is nothing wrong with having technical dashboards, on the contrary, it is a very useful tool to locate relationships and problems in our systems and services. The problem arises when we only have technical dashboards, usually referred to our infrastructure, increasingly complex: kubernetes, cloud, legacy, serverless, multicloud, and so on.
Well-done monitoring must be done in the opposite direction to that in which it is usually done. We must start from the "top", closer to the business than to the speed of the hard disks.
Effective and value-adding monitoring from the first metric is based on the following principles:
Well-done monitoring must be done in the opposite direction to that in which it is usually done. We must start from the "top", closer to the business than to the speed of the hard disks.
Effective and value-adding monitoring from the first metric is based on the following principles:
- Define the critical business metrics that need to be measured, what their prioritization is and what is expected from them: number of users, number of records, failed records, number of abandoned carts, sales, etc. The fact that managers do not understand technicalities or business metrics technicians is not an obstacle but sometimes things become much clearer. This is also where many correlated metrics tend to emerge, such as "cloud infrastructure cost" + "number of self-climbing instances": very different but interrelated perspectives provide more information, put many indicators into context and put them into perspective by focusing on efficiency and success.
- Establish the metrics on what it means that the service is available: that our website loads in X milliseconds, that our APIs are accessible, that our users can login, etc. but taking advantage of what was done in the previous key, that there are no logins or increase in the number of failed registrations can be a symptom that something is going wrong.
- From here, we will go down from the general to the specific, with new dashboards that will help us locate the ultimate cause of the problem to solve it. This is essential to avoid being constantly attending to alerts that do not really affect the service, or the business.
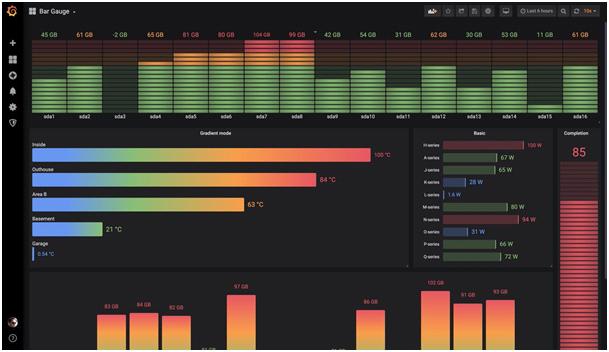
There is always the temptation to do it the other way around: first collect all the metrics we can think of even if we are not very clear about what they mean or how they impact on the service, default alarm templates, etc. and then start pruning; but this usually leads to the task of visualizing all that information being titanic, which in turn will lead us to pay less and less attention to it, which loses all its usefulness.
Once we have reached this point, our high-level dashboards should be very simple and reflect those business and service status indicators we need, which anyone can understand and allow us to detect if there is a technical problem or the problem has been to turn off the Adwords campaign in August.
Tools such as Minerva, based on Zabbix and Grafana, help us define the availability of services based on different types of alarms.
There are a number of additional advantages to working in this way:
- Savings in monitoring and development infrastructure costs: collect and store metrics that only a database analyst with 10 years of experience is able to understand has a very high hardware cost (including the number of screens to install in the office), as well as development and adjustment of tools. We guarantee that after this process you will also need a tool to monitor the monitoring platform itself.
- Better understanding of the business and working together with the technical part, something beneficial for both parties that also helps to create a collaborative and trusting environment. A company in which only those with systems have dashboards in real-time... they would be probably working in a separate room or basement. We have to put an end to this: if we don't stop saying that technology is key to business, let's put it into practice!
- The thinking of the entire team will be more service-oriented, SLAs oriented, and properly prioritized and alarmed. It is not uncommon to find cases in which a user calls "Web is not working" and the technician responds "I see all the servers up and green", to which the user replies "Can you try from your browser?", "OK, we're going to check".
But don't worry, even if you currently have more metrics per minute than your Apache or Nginx visits, it's a great exercise to consider this from zero: What conditions must be met to consider that my web service is up? And I'm sure the answer goes far beyond a ping, but it doesn't reach the number of users who connect to your website from a city of more than 20,000 inhabitants with a beach. We think this is good homework for this summer 😊

CEO & MANAGING DIRECTOR
Expert in IT monitoring, systems and networks.
Minerva is our enterprise-grade monitoring platform based on Zabbix and Grafana.
We help you monitor your network equipment, communications and systems!
Subscribe to our Newsletter

