

Zabbix: Integration and plugins with other tools
April 30, 2017
Zabbix out of the datacenter. Success stories in the retail and automotive sectors.
October 23, 2017
What's new in Zabbix 3.4 - Dashboards, dashboards!
From a few days ago, we have already available to download the awaited new version of Zabbix, the 3.4. You can check here in detail all the new features. In this post, we'll try to focus on what it was, maybe, one of the most awaited features, the possibility to design customized dashboards in a more flexible manner than in previous versions.
In fact, until now, if you wanted to build more complex dashboards, you necessarily have to design Zabbix "screens" with the elements you needed and there were some useful elements you could not use like "Problems". We understand in fact that the use of Zabbix "Screens" will be more focused as templates to monitor, for instance, several data from a type of server and "Dashboards" will be more oriented to general vision and operation, plus the interactivity, almost like a higher hierarchical level to the "Screens". We'll see how these two features evolve in next releases.
In the first place, we found that we have more possibilities to manage dashboard space (until now we only had 3 columns). Trough a drag&drop system, we can organize different widgets as we want, being able to modify the size of any of these to our needs:

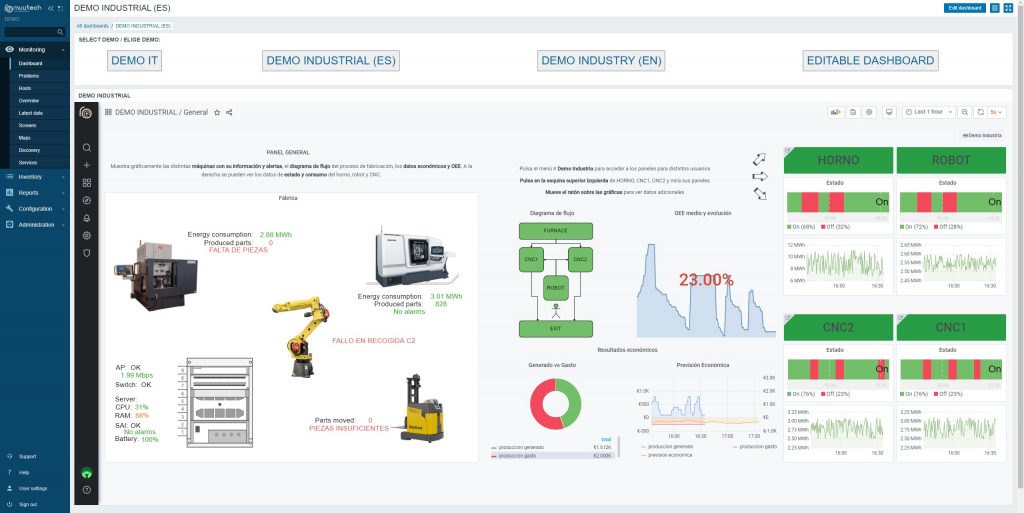
Most of the widgets we can add are old friends from the Zabbix "Screens", we wait they open them in a way community can create new ones to facilitate the integration with other tools. We notice Zabbix has added a very interesting widgets called "Map tree" making easier navigation trough maps, even being able to place a board where the selected map will be shown in a dynamic way. So, we can quickly generate something like this:

Now Zabbix gives us the ability to have multiple dashboards and manage how and with which users we share them, etc. Cool, right? Several times, if we have different people operating our network and systems, they need different views and have the possibility of customizing them.
In any case and if this is not enough for your needs, you can always try the integration with dashboards and graphics from Grafana o the build, trough the Zabbix API, of customized dashboards, services we can offer from Muutech :), just reach us.
You can check this and all the new features in version 3.4 in our online demo. There you will find a fully editable dashboard to play and test by yourself! Enjoy!

CEO & MANAGING DIRECTOR
Expert in IT monitoring, systems and networks.
Minerva is our enterprise-grade monitoring platform based on Zabbix and Grafana.
We help you monitor your network equipment, communications and systems!
Subscribe to our Newsletter

1 Comment
Nice article