

How to avoid alarm flapping in Zabbix 3.2
March 19, 2017
What’s new in Zabbix 3.4 – Dashboards, dashboards!
August 26, 2017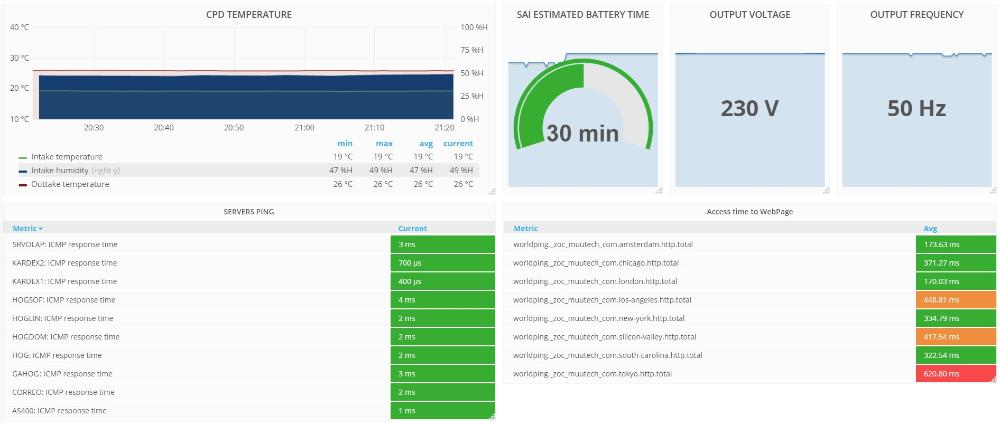
Zabbix: Integration and plugins with other tools
Today it is very important that the applications that we put into operation in our companies are not isolated silos, limiting our productivity, efficiency and traceability and, in the case of monitoring, preventing event correlation.
Zabbix is already used to combine different metrics, sensors, database information, etc. from different sources, including cloud monitoring systems such as AWS CloudWatch, application performance such as AppDynamics or monitoring logs such as Logstash.
This is one of our strengths and advantages with our customers, and we are very satisfied with what we can do with it. But many times, even if Zabbix comes to fill a gap in our customers' monitoring systems, they already have some other DevOps tools for they daily work tools such as:
- Automation / orchestration tools like Ansible: you can use Zabbix as an inventory source for Ansible playbooks, being able to use its groups, etc.
- Advanced notification and incident management and communication tools such as: Telegram, Twitter, Slack, FlowDock, Neptune.io, PagerDuty, OpsGenie, VictorOps, Atlassian Confluence, etc. either through scripts or through plugins of the applications themselves.
- When generating an alarm in Zabbix (we can filter by alarm level, affected services, etc.) we can cause it to generate an incident in PagerDuty, which notifies according to the configuration level service that we have hired (one of the key features of PagerDuty is the different user-scaling options that it offers, depending on the time, type of ticket, etc.).
- This incident on PagerDuty can automatically generate one in ServiceNow being both incidents synchronized through PagerDuty itself... so that we will be integrating Zabbix and ServiceNow!
Currently our Zabbix based service includes Grafana by default for dashboards. From now on you will not have to worry again about the technical part, or dedicate lots of hours to set up those dashboards that your equipment needs.
In general, Zabbix is tremendously integrable and customizable, from setting up an email to your Jira or BMC Remedy to generating a ticket or script which allows Zabbix receive user complaints from other tools. Because of its increasing popularity we can already find in the market several integrations such as the ones we have been discussed. Anyway, should you or your company need something specific for a owned tool, or one that does not appear among those mentioned, do not hesitate to contact us.
In general, Zabbix is tremendously integrable and customizable, from setting up an email to your Jira or BMC Remedy to generating a ticket or script which allows Zabbix receive user complaints from other tools. Because of its increasing popularity we can already find in the market several integrations such as the ones we have been discussed. Anyway, should you or your company need something specific for a owned tool, or one that does not appear among those mentioned, do not hesitate to contact us.

CEO & MANAGING DIRECTOR
Expert in IT monitoring, systems and networks.
Minerva is our enterprise-grade monitoring platform based on Zabbix and Grafana.
We help you monitor your network equipment, communications and systems!
Subscribe to our Newsletter
