Improvements and news in Zabbix 4.4
December 3, 2019
Monitoring, an ally in times of war
March 22, 2020
Server monitoring with iLO (HP), iDRAC (DELL) and IPMI technologies with Zabbix
The servers are the nerve center of your company. It's important to take care of it.
In today's world, servers are becoming more and more important. Not only in companies purely focused on the IT sector, other firms even those dedicated to production, retail or logistics, increasingly depend on servers and computer equipment for their operation.The importance becomes so great that this equipment can become a fundamental part of any process. Therefore, not only are the tasks they perform important, but also the devices themselves on which they depend. That is where monitoring comes in.
What technologies are available for server monitoring?
If we talk about monitoring and management of servers Hardware, the first names that come to mind are iDRAC (Integrated Dell Remote Access) and iLO (Integrated Lights-Out), both technologies for maintenance of servers "out-of-band", without dependence on the operating system.As an initial summary, iDRAC is a proprietary technology of DELL while iLO is part of HP. Both derive from IPMI, the standard created and maintained today by Intel, adding in many cases the possibility of management and integration with the specific hardware of each device.
Why would you use these technologies?
Unlike other monitoring technologies, as we mentioned before, they work independently of the operating system, so they give us many advantages:- Is not necessary to install anything.
- It is independent of the virtualization you have installed (regardless of the number of virtual machines you never lose the overview of the server)
- Possibility to perform actions on the equipment itself even if the equipment is turned off (Depending on the hardware of the equipment)
A standard that many times is not enough
Typically, proprietary management solutions such as those we see in this text provide greater integration with the hardware and often have better features (monitoring, logging, access) than a generic IPMI implementation.But more importantly, all of the services mentioned above comply with this standard (or a specific version of it), so you can use specific tools of these technologies or standardized IPMI tools if you do not need the extra features. This can be an advantage in case you need to integrate the infrastructure with some monitoring system that is compatible with the standard and not with the specific vendor solutions.
Differences between iLO and iDRAC
There is not much difference between Dell's iDRAC and HP's iLO since both are developed in a similar way to achieve the same goals, we could say that both brands have the same type of technology with different names.While it is true that the HP solution may seem easier to use at first glance compared to the DELL solution, both have the same features and functionality. Neither will be a determining factor in choosing the new servers for your company.
Server monitoring
Taking advantage of the possibilities of these protocols and the capabilities of Zabbix for monitoring equipment, our goal is to keep the servers under control with no downtime.To do this, it is not necessary to make many developments, Zabbix itself already incorporates some tools that will make the task much easier:
- HP server monitoring (iLO)
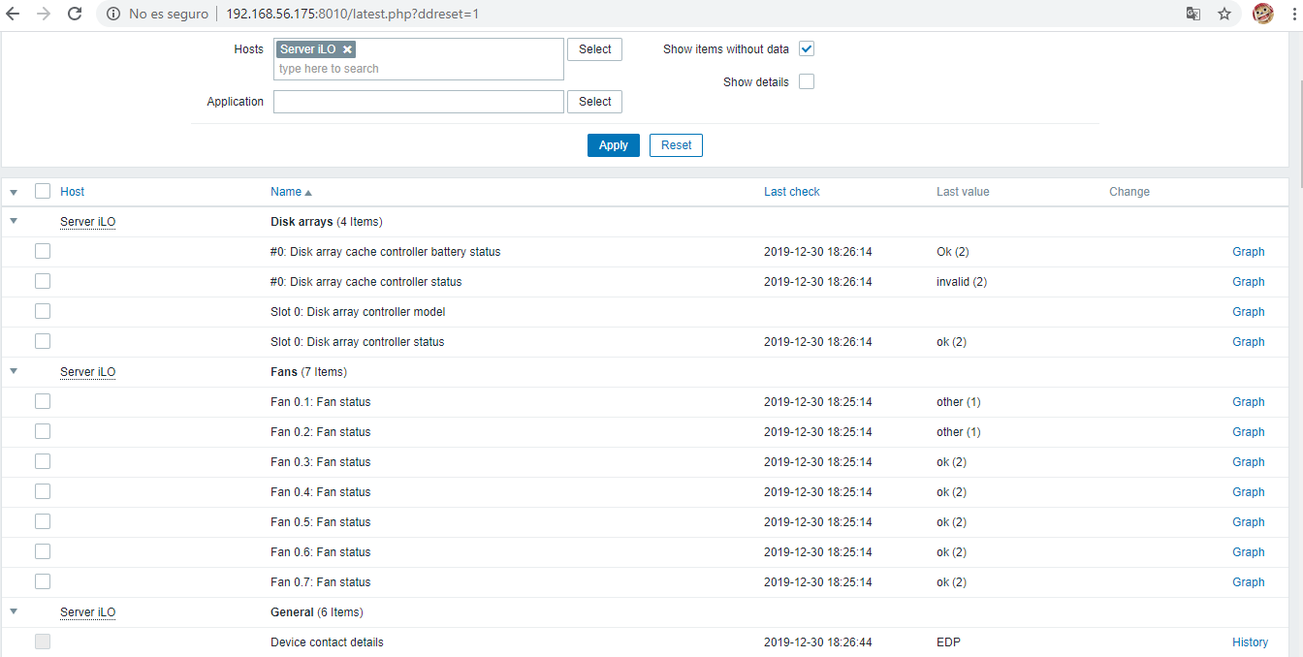
By default, Zabbix has a specific template for monitoring iLO-compliant servers capable of obtaining basic server data such as serial number, model, whether it is on or off, time, etc. As well as to auto-discover more complete and interesting metrics such as CPU data, fans, memory, disks, etc.
- DELL server monitoring (iDRAC)
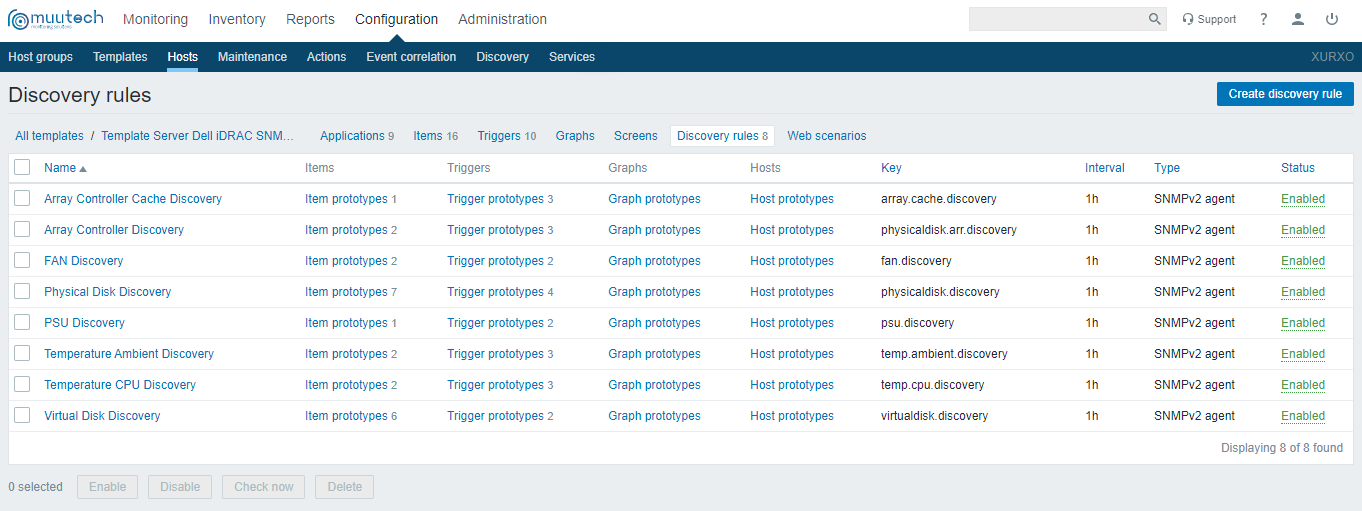
As in DELL servers we also have the possibility of monitoring all types of data and self-discovering others depending on the hardware capabilities of our server.In this case, we may lose the possibility of monitoring memory temperatures, but in general, the capabilities are very similar.

- Generic server monitoring with IPMI
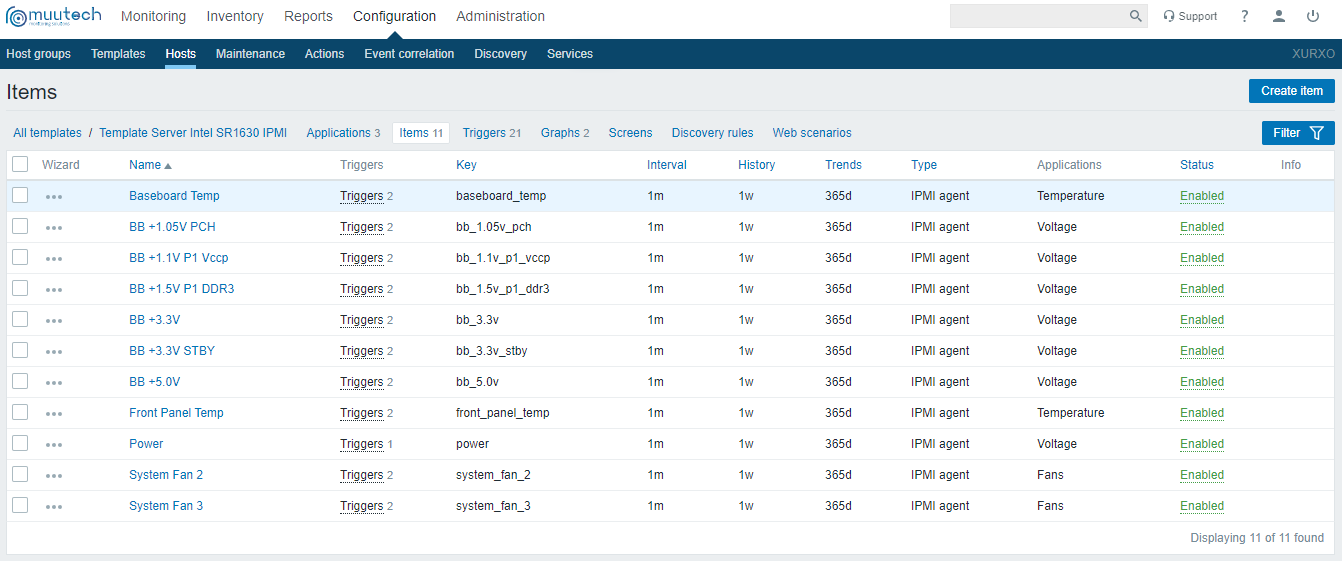
If our server does not have either of these technologies, but supports the Intel IPMI standard, Zabbix also gives us solutions for the SR1530 and SR1630 series.We will not have as much data as with the two previous solutions, nor the autodiscovery (at least by default). But we will have the option to measure data of temperatures, batteries, fans and much more, although we will have to build them ourselves according to the IPMI specification.

Unlike the other two templates (iLO and iDRAC) that used SNMP for data collection. In the case of the latter, the IPMI capabilities developed on Zabbix are used directly, which allows them to be obtained more easily using the system's ipmitool utility.
By default, Zabbix is configured with the number of IPMI pollers to 0, so any item that uses this technology will not receive any data. To use it, it will be necessary to modify the zabbix_server.conf file and edit the next line changing the 0, by the number of pollers necessary to obtain the data depending on the expected load.
Perhaps that point is the most complicated, since obtaining the data is simple, but customize it to suit the needs of each and not drown in a screen full of alarms that does not say anything. To do this, it is advisable to be advised by experts, with a methodology and experience in monitoring so that they can bring the data obtained to fruition.
With servers, contextualization is even more important. The same team could be in charge of an ERP on which the production depends or of the website in front of the public, so we must know in a simple way against what kind of problem we are facing in order to act correctly.
By default, Zabbix is configured with the number of IPMI pollers to 0, so any item that uses this technology will not receive any data. To use it, it will be necessary to modify the zabbix_server.conf file and edit the next line changing the 0, by the number of pollers necessary to obtain the data depending on the expected load.
# StartIPMIPollers=0
Next steps.
Only with the default templates provided by the Zabbix team, we have already made a lot of progress. They even have the addition of the triggers and alarms previously configured to warn us of possible problems that may happen to our equipment. Be that as it may, we can always add other capabilities such as the union with the services that these servers are running, which could put us in context the information obtained directly from the templates.Perhaps that point is the most complicated, since obtaining the data is simple, but customize it to suit the needs of each and not drown in a screen full of alarms that does not say anything. To do this, it is advisable to be advised by experts, with a methodology and experience in monitoring so that they can bring the data obtained to fruition.
With servers, contextualization is even more important. The same team could be in charge of an ERP on which the production depends or of the website in front of the public, so we must know in a simple way against what kind of problem we are facing in order to act correctly.

CEO & MANAGING DIRECTOR
Expert in IT monitoring, systems and networks.
Minerva is our enterprise-grade monitoring platform based on Zabbix and Grafana.
We help you monitor your network equipment, communications and systems!
Subscribe to our Newsletter


