Monitoring, an ally in times of war
March 22, 2020
Do you monitor what should only work when everything else fails?
August 26, 2020

Monitoring, key to performance when working from home
Make teleworking only mean the fridge is closer than the office.
We have read everything necessary about how to optimize the home office experience: doing daily routine, getting dressed, taking a shower, having breakfast, etc., having a dedicated and adequate space with its good table, its chair neither very comfortable nor very uncomfortable, etc. We start the day and with it our PC. We start the VPN software and we "connect". This step used to go very fast, but since many of us are working from home because of the COVID-19 pandemic it takes a little longer each time. I assume this is normal so I don't notify anyone. And no one in IT is aware of it, are they?
Monitoring of teleworking infrastructure
There are several key factors to consider in the telecommuting user experience:- User PC performance.
- Performance and quality of the user's internet connection.
- Performance and quality of the connection of our office datacer or where we have the servers and resources: this includes the bandwidth and connection (DSL, fiber, etc.) as well as the performance of the VPN connection.
- Performance of servers and applications used by employees: ERP, CRM, etc, whether on our servers or in the cloud.
- If we use software in the SaaS cloud, the performance of the connection with these, depending on where they are hosted (private cloud or provider cloud)
When we talk about user experience it may seem that it only impacts on how happy or unhappy our teleworkers are (which also, and this is a very important point) but the most relevant thing is that it is something that directly impacts on the efficiency and effectiveness of their work, on the performance of the worker.
This, of course, is something that already happened in the office, where the quality of the connections disappeared from the equation, but where there was a key element and sure enough it sounds to all of us: "Hey, the ERP is going badly, is it happening to someone else?", or commenting on it with the IT people on a break. In our head at the office everything must be fine since we internalize precisely where there are usually more problems in the internet connections and since there are no such connections everything should go smoothly. Besides, it doesn't cost us anything to lift our heads from the monitor and ask questions aloud. In our home office maybe we can ask the cat, but as we are not yet used to using the communication tools (chat, etc.), we try "not to bother" and, moreover, we blame the problem on our children watching Netflix or our partner downloading something for his or her work, we do not give it importance, and we do not report it. Consequence: if before it took an hour to generate some purchases in the ERP, now it takes two hours.

Employee performance continues to be measured in the same way, and managers will see that the performance of certain employees (those using the ERP) has dropped by almost half: "I'm sure you're watching Netflix instead of working" is met by "My home wifi is not working well"; and it may actually be a performance problem with the ERP or VPN. IT to the rescue!
Monitor all points in the chain
We are going to analyze what data can be interesting from each of the links mentioned above. We start with the user's PC and its connection to the Internet: a personal computer should be monitored in a different way than a server and normally with accumulated statistics of the day:- 100% CPU time
- 100% memory time
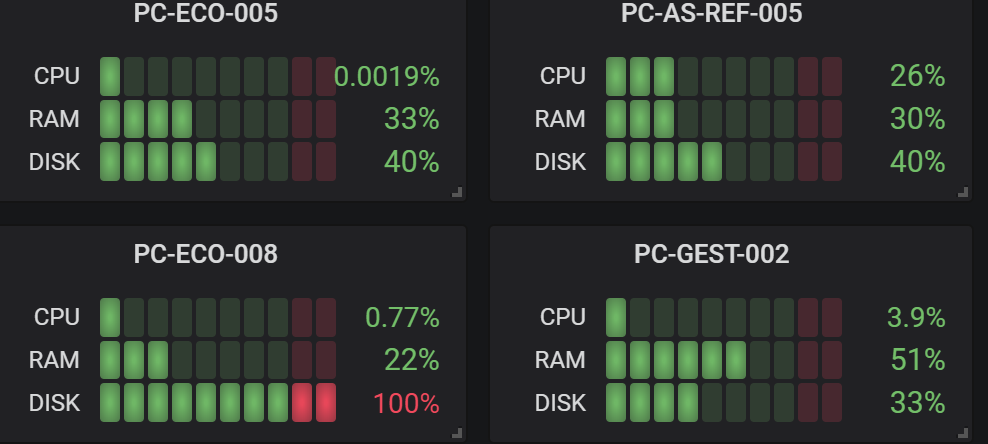
- Bandwidth saturation / Internet response from the PC itself. We can even measure the response to our offices or equipment (latency to ERP for example)
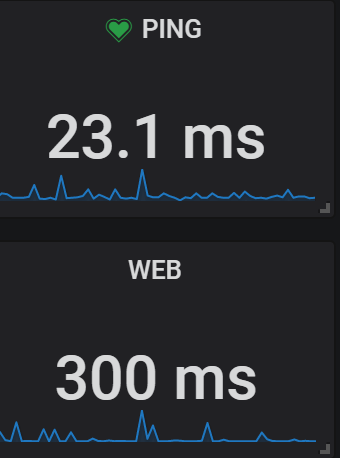
Although there are a couple of points that if it is convenient to monitor with instantaneous alarms such as the SMART state of the hard disk to proactively detect the degradation of the disk or the free space available on it, which if it reaches 0 can be fatal in a Windows operating system.
With this data we can know if the user is having problems with his PC (either because of the use or the capacities of the PC). In addition, if we are working with Muutech's solution, we will be able to connect from the panel itself via AnyDesk or Wifra.
Something very similar will be used to measure the quality of the internet connection from each of our locations, as well as a bandwidth control at the router and firewall level. The central point will be the VPN, so we can collect and relate the session load, VPN users and performance of our firewall (Fortinet, SonicWall, OpenVPN, etc.):
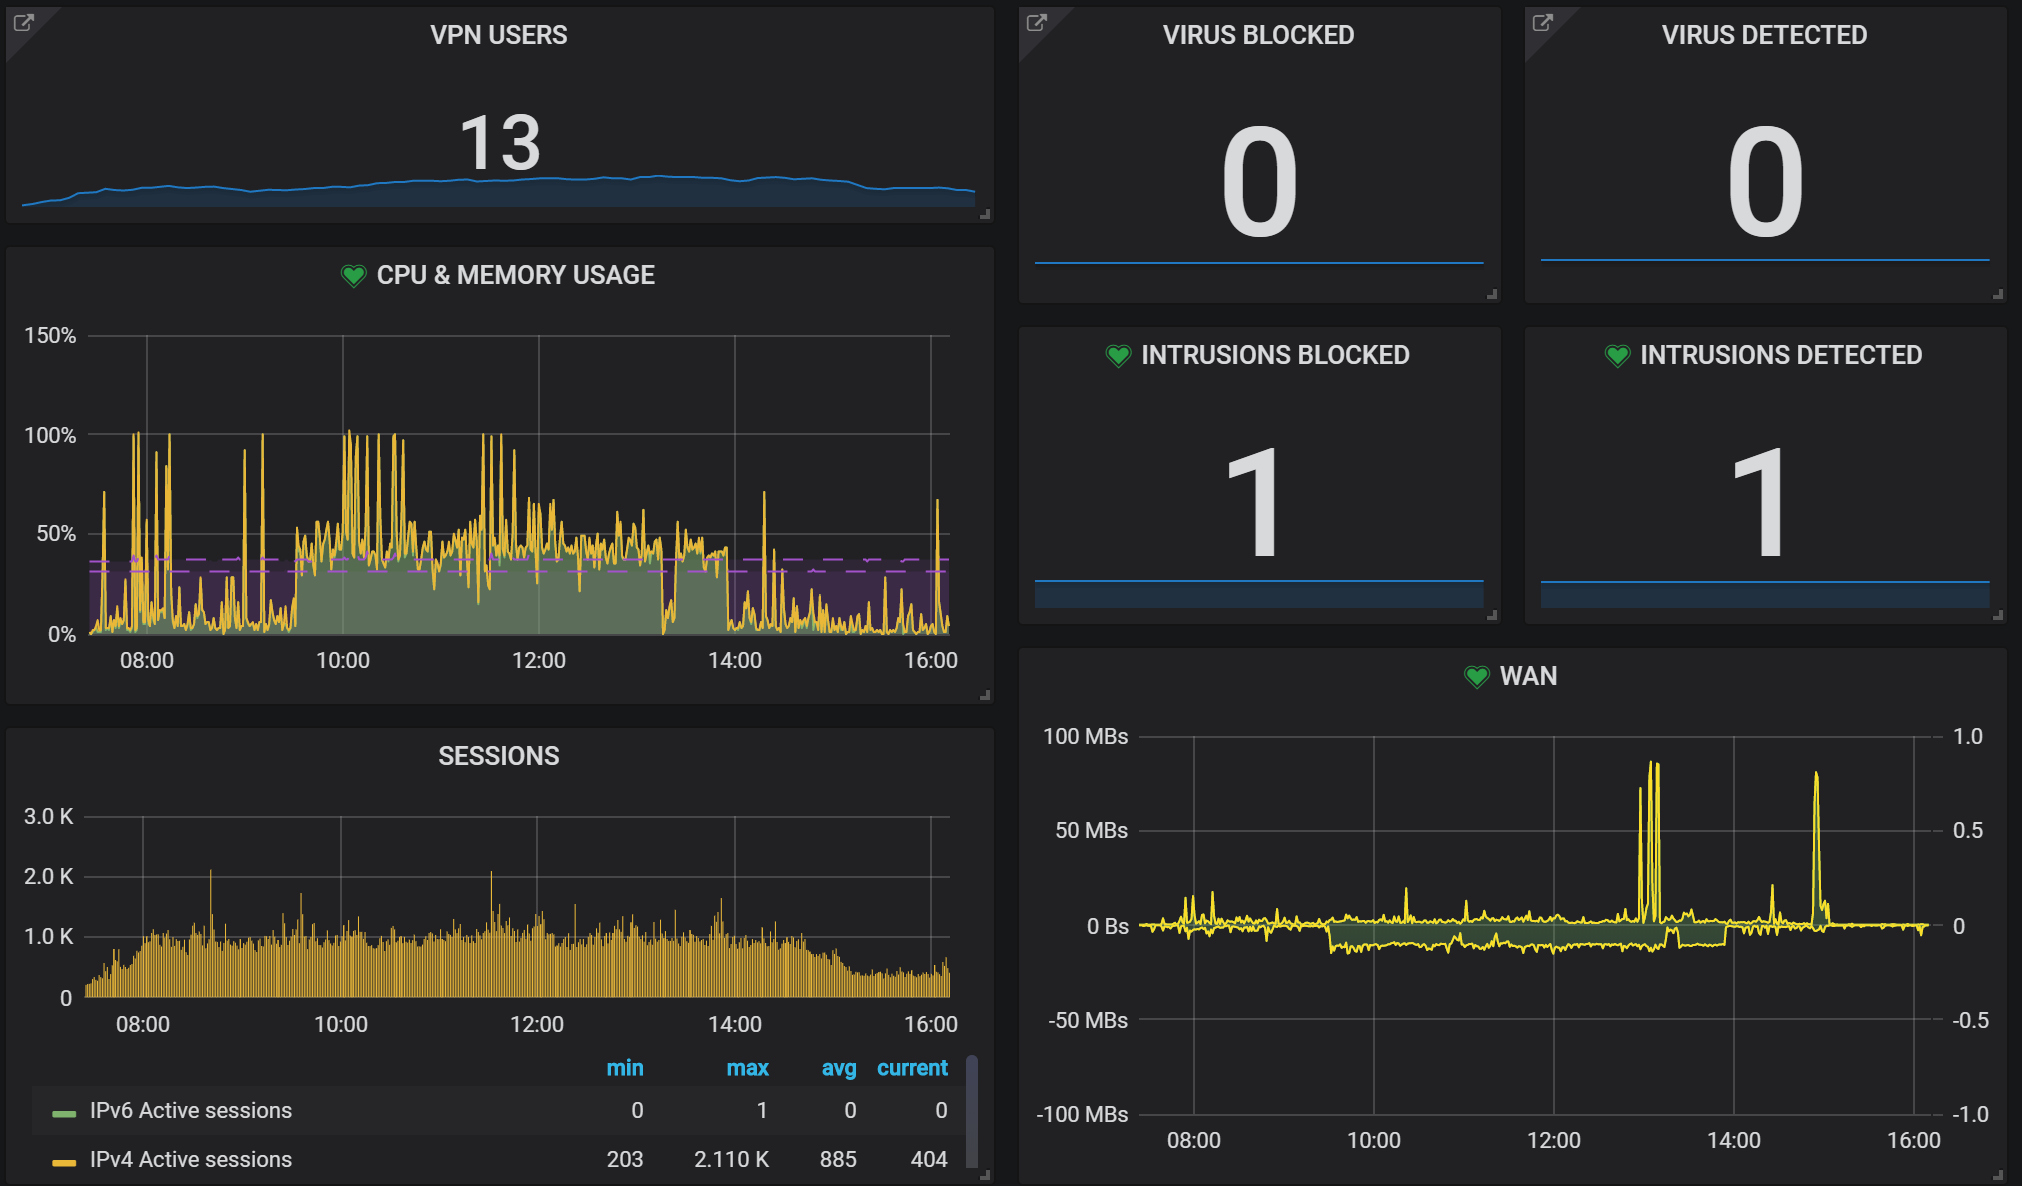
This is a real example of a Fortigate device for a project carried out together with our partner LightEyes, experts in cyber security and VPN solutions.
This gives us an overview of how much load the firewall has and how it supports it, of course with the system warning of any alarms. But it is necessary to go a little more into detail and see how the users of the VPN are behaving:
This gives us an overview of how much load the firewall has and how it supports it, of course with the system warning of any alarms. But it is necessary to go a little more into detail and see how the users of the VPN are behaving:

Here we can see where our users are connecting from, being able to detect connections from other countries or unusual ones, how much time they spend online, how many sessions they open, if VPN connections are restarted frequently, the peak bandwidth consumed in each direction, as well as the amount of data going up and down. And this data can be broken down and summarized by day or week.
Why are they interesting? Well, for example, if we see that the sessions are restarted frequently, it could be a symptom of some problem. Another very relevant example is the use of bandwidth. We can see in the general graph when it is saturated and then see in detail which users saturate it. These users will surely have in common a certain profile that they need for example to access a series of files or documents: the idea may not be to restrict their access to them, which would impact their work, but rather to try other file sharing solutions with local copy or more efficient, intermediate caches, etc. or even to conclude that we should hire more bandwidth. In short, key information to improve and get our employees to telework as if they were in the office.
Having the historical data allows us to do aggregate analysis such as, what has happened in the last 7 days with respect to bandwidth and activity? Do people connect at the weekend? These are the graphical answers (5/23 was Saturday):
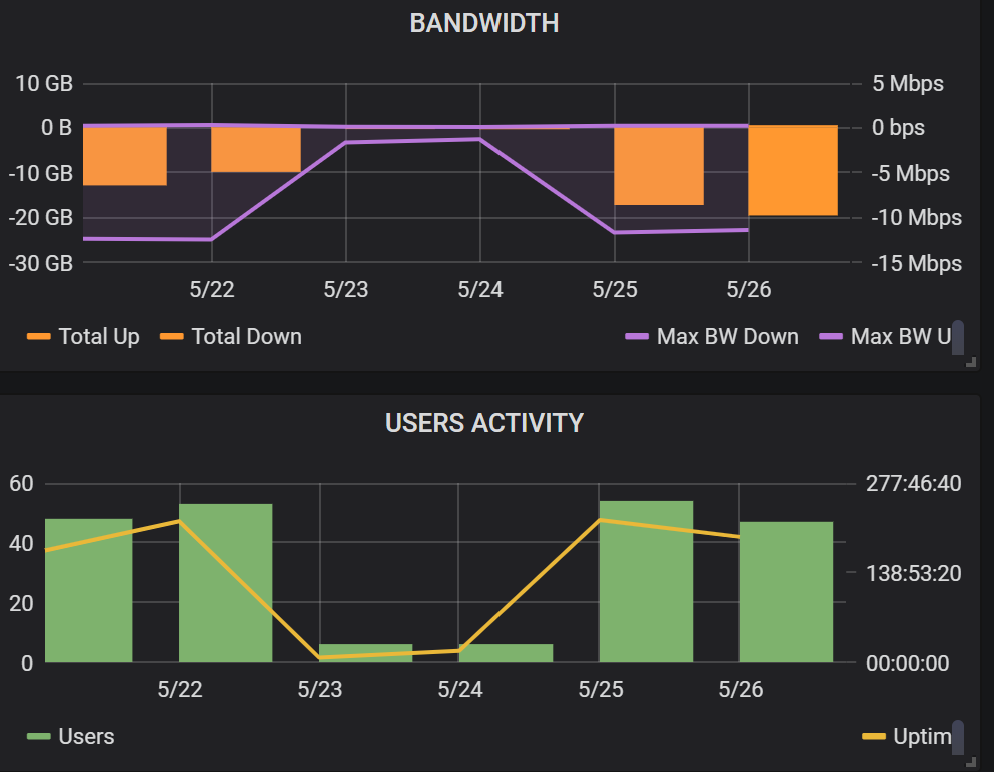
It also helps us to see trends, has the use of teleworking decreased with de-escalation?
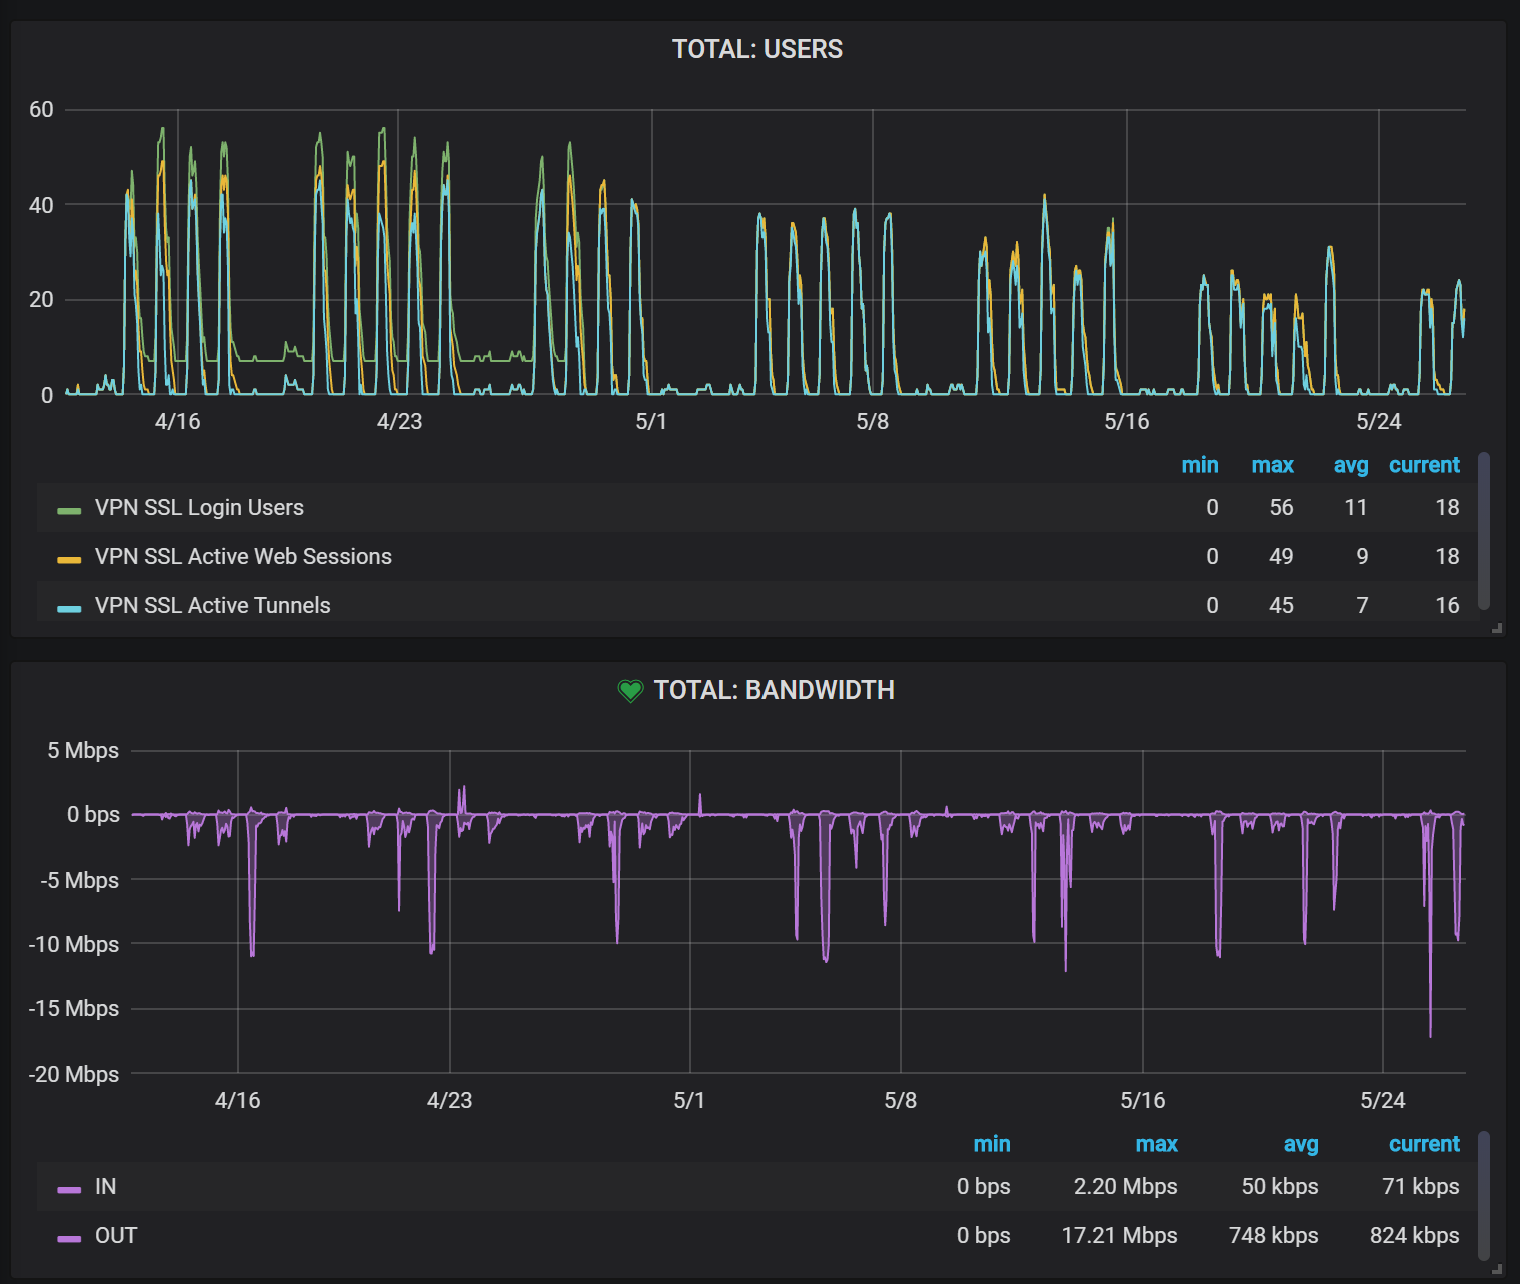
The last two points would be the monitoring of our servers (whether Linux, Windows or AS400) and applications (whether on-premise or cloud or SaaS format), where we can collect, among many others, data such as:
As we see the data gives us answers and helps us to dimension our infrastructure and give the most efficient service possible to our teleworkers so that they have in an optimal way all the tools to do their job, which results in the global benefit of the company. In addition, it allows our IT team to provide remote service proactively, anticipating problems, receiving alarms and having a platform that is their eyes 24x7, greatly reducing the time they previously spent on these tasks, which they may now spend on improving our products or value-added automation for the company.
If you still have doubts about the advantages that teleworking monitoring can bring to you and your company, we invite you to visit the following link:
- CPU consumption, Memory, Disk, Bandwidth, etc
- Performance metrics for web servers, databases, etc
- API response times, external SaaS services
As we see the data gives us answers and helps us to dimension our infrastructure and give the most efficient service possible to our teleworkers so that they have in an optimal way all the tools to do their job, which results in the global benefit of the company. In addition, it allows our IT team to provide remote service proactively, anticipating problems, receiving alarms and having a platform that is their eyes 24x7, greatly reducing the time they previously spent on these tasks, which they may now spend on improving our products or value-added automation for the company.
If you still have doubts about the advantages that teleworking monitoring can bring to you and your company, we invite you to visit the following link:

CEO & MANAGING DIRECTOR
Expert in IT monitoring, systems and networks.
Minerva is our enterprise-grade monitoring platform based on Zabbix and Grafana.
We help you monitor your network equipment, communications and systems!
Subscribe to our Newsletter
Related posts
January 12, 2020


