

AWS monitoring with Zabbix and Grafana
April 8, 2019
Message queues today
April 30, 2019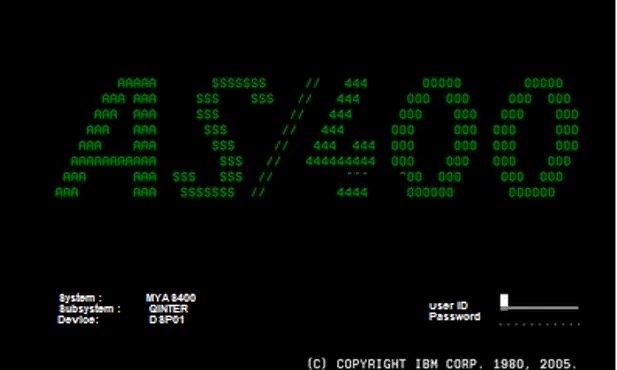
IBM AS400 Monitoring with Zabbix
Origins of IBM AS400
Some of you may not have heard of the "AS/400," also known as the iSeries or Power Systems, in their most modern versions. Others of you may have been working with them for years, as they have been in business since 1988. More than 30 years in which an expensive and robust system still governs many processes in many companies: why? Mainly because it is still possible to run a 1988 program on the latest version of the system, with little or no change. This guarantee of continuous compatibility allows companies to renew systems and grow without having to continually rewrite their software. That is to say, imagine the potential of making a Javascript application for example in a framework that you knew that in its version in 30 years will continue to work; it sounds impossible, right? Well, that's why they are so appreciated and are still being sold.
Over time, IBM has not managed to stop people from calling them AS/400 and therefore sound old and untouchable, especially when we see their console (look at airports when you go to board, in many will see THAT console reading a QR from your mobile). But the reality is that they have been evolving and including modern technologies, so it is not uncommon for them to be used for Java or Python application servers or Apache web servers with PHP and MySQL.

Because of their cost, it is not common to find many in companies, but running business critical systems 24/7, such as ERPs or logistics systems. Therefore, and although they are very robust machines should not escape our monitoring system.
The most common solution to monitor this equipment has historically been to use SNMP. It is necessary to activate it in the AS400 and normally it is the V1 version of the protocol. In general, it works quite well and covers the basics:
In general this part of the monitoring will help us to realize if someone has restarted the server or if our applications are consuming too much memory. In fact, it is very common for periodic "reboots" to be programmed in these computers to recover memory (when, at the end, it is a software problem).
The most common solution to monitor this equipment has historically been to use SNMP. It is necessary to activate it in the AS400 and normally it is the V1 version of the protocol. In general, it works quite well and covers the basics:
- Basic inventory data: model, equipment name
- Uptime
- CPU
- Memory
- Number of processes
- Number of users
- Network usage
In general this part of the monitoring will help us to realize if someone has restarted the server or if our applications are consuming too much memory. In fact, it is very common for periodic "reboots" to be programmed in these computers to recover memory (when, at the end, it is a software problem).

But there's a fundamental part that doesn't cover: the status and use of disks, as well as the control of processes or jobs, subsystems and message queues. This was a problem and several solutions were raised, there were even people who came to try to compile the agent for the AS/400, until Constantin Oshmyan came up with the idea of using the Java API (IBM Toolbox) shipped in the AS/400 and make software in Java that emulates a Zabbix agent.

With this, he achieved something very powerful, since this emulator can be installed both on the IBM server and on an external machine, for example, our proxy or Zabbix server. The only condition is to run the Java JRE in a version higher than 1.7, with a couple of small dependencies. You can see the full explanation at the 2017 Zabbix Conference.
It should be noted that there are some limitations, but they do not really represent a problem: it is not compatible with IPv6, there is no encryption and not all the metrics of a normal Zabbix agent are implemented, such as remote execution of commands or the famous UserParameters.
Once installed and configured properly, we can begin to monitor the status of those jobs that we want to keep monitored, even knowing their specific consumption of CPU and memory, and send us an alarm if any falls. It can also warn us when there is some work stopped waiting for the action of an operator (errors when printing, etc).
Once installed and configured properly, we can begin to monitor the status of those jobs that we want to keep monitored, even knowing their specific consumption of CPU and memory, and send us an alarm if any falls. It can also warn us when there is some work stopped waiting for the action of an operator (errors when printing, etc).

In addition to these metrics, the agent allows very interesting things such as job discovery based on their CPU consumption, to make a list of the most consumed in general, or the failure detail of any disk, as well as the status of the default services of the iSeries: database, files, printers, and so on.
With these steps and combining both monitoring we can have very controlled the AS400 of our company from a single tool to which you can add your Amazon or Azure servers or your Docker microservices. The reality of companies is that they end up having an amalgam of technologies and this should not imply having monitoring spread over multiple applications that complicate us in locating the root cause or correlate events when problems occur.
If you want Muutech to help you with the monitoring of your IBM AS/400 or iSeries or PowerSystems, or whatever you call them, do not hesitate to contact us.


CEO & MANAGING DIRECTOR
Expert in IT monitoring, systems and networks.
Minerva is our enterprise-grade monitoring platform based on Zabbix and Grafana.
We help you monitor your network equipment, communications and systems!
Subscribe to our Newsletter


