

Zabbix can go much further. Monitoring in Retail
April 1, 2019
IBM AS400 Monitoring with Zabbix
April 16, 2019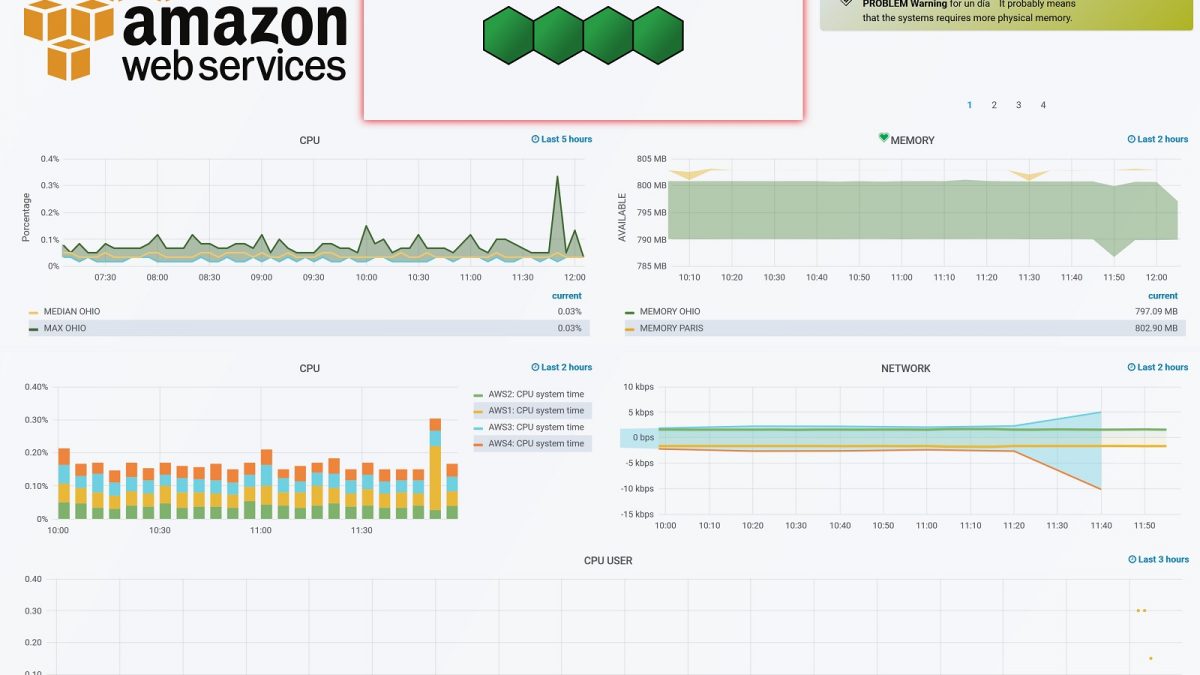
AWS monitoring with Zabbix and Grafana
On earth or in heaven
Regardless of the business model, migrating data or services to the cloud has become a solution to consider because of the abstraction it offers. Its main advantage stems from a basic foundation, knowing our current needs and being able to adapt to future ones. Such rapid elasticity and flexibility is only offered by cloud services. This solution is suitable for all types of companies: from a small company, to which an investment in systems for its services means big headaches looking for a balance between needs and investment capacity, to a multinational that does not cease to grow and therefore it is difficult to scale, without underusing its services, at the pace of its growth.
High availability, scalability, speed of implementation, low operational costs, possible relocation of equipment, savings in training and hiring qualified employees, as well as delegation of computer security, and so on. They make the cloud an unbeatable rival beyond supposed fads.

Starting from these paradigms we can build our system, for this we will focus on the case of cloud computing. Let's suppose that our model is based on a web service, this forces to maintain a permanent service open and available on the network, any fall in our system directly affects the health of our company. Having the system to provide this service requires not only technical knowledge for its maintenance, but also investment to obtain it, as well as a physical space to house it. All this could be solved with a "renting" of these services, hire both the physical space, its technical abstraction and a high availability of our equipment.
There are multiple platforms that offer these services, being the most outstanding: Amazon, Microsoft and Google. Each of them offers different rates but similar services.
There are multiple platforms that offer these services, being the most outstanding: Amazon, Microsoft and Google. Each of them offers different rates but similar services.
This time we are going to focus on Amazon Web Services (AWS), we are going to see how we can, using an Iaas model, build a system from scratch that is ready to host our services and we will see in this way that either in the cloud or in our Datacenter, control is vital to our business.
Once created our account and initiated our access we will have before us perhaps too many options, Amazon contains abundant documentation about how to use its huge options and services. The first thing we must do is generate an instance, host our operating system, configure our "key pair" and customize the security settings.
Amazon Guide: https://docs.aws.amazon.com/efs/latest/ug/whatisefs.html
In our case we have chosen a Centos7 system, seeking to reproduce the environment of our old infrastructure. We enable a security configuration that allows the entry of certain IPS through the TCP protocol, as well as ICMP messages. Once our system is configured, we will add the most important elements needed by the characteristics of our service. This phase depends a lot on our preferences and the approach of our migration. For this example, several replicated instances have been generated and located in some of the different zones allowed by AWS. In this way, we try to make the most of the advantages of the cloud in the global network.
Recapitulating, after analyzing how positive it is for our business to move some element to the cloud and choose the right time to do it, we must ensure that we maintain the differentiating element of Cloud, the provision of infrastructure must be aligned to actual demand at all times. This must happen not only in the initial sizing, but must be dogmatic for our entire stay. This follow-up takes a large part of the advantages that Cloud offers us, and its importance outside this "virtualized" world is also well known.
Monitoring
AWS allows us to monitor our instances almost free of charge. The service known as CloudWatch shows us the metrics of our instances with a frequency of 5 minutes with certain limitations in "free" mode. Some of the metrics are requested through the API and are paid after a certain number of queries (Any type of Amazon billing involves an effort of understanding according to its volume and huge options).

Although AWS's level of data access is unsurpassed, its metrics and abstractions leave much to be desired. While its basic graphs detail the different values of certain metrics, they leave the user all their analysis, just abstracting and adding metrics. Any attempt to generate alerts or customize our monitoring becomes an arduous and not at all intuitive task, even creating complex relationships for simple monitoring. CloudWatch does not allow us to obtain a complete view of our system, it does not show states differentiating them, for example, by colors. On the contrary, it shows raw and segregated data by instances, which means that the general analysis will be done navigating through each one. We must therefore assess their metrics as a whole, draw our conclusions, really something that is contrary to some of the principles of simplicity by which we migrate. In summary CloudWatch turns monitoring into the sum of many clicks per instance, even more if they are not in the same location, and extrapolation of data from their graphs, an unnecessary job with a good monitoring system but vital to our business.
The analysis of our system is the cornerstone of our future, the adaptation to real needs, efficiency and availability are paramount and for this we must have a customized tool adapted to our system that shows us at a glance the current state of our infrastructure, with alerts and thresholds adapted to give us a deep knowledge of the health of our system. You can see data aggregated by groups of instances regardless of their location, saving historical time considered, allowing you to go into detail and analyze once detected a problem, its origin.
The analysis of our system is the cornerstone of our future, the adaptation to real needs, efficiency and availability are paramount and for this we must have a customized tool adapted to our system that shows us at a glance the current state of our infrastructure, with alerts and thresholds adapted to give us a deep knowledge of the health of our system. You can see data aggregated by groups of instances regardless of their location, saving historical time considered, allowing you to go into detail and analyze once detected a problem, its origin.

From Muutech, specialists in monitoring, we have created this example of a panel for the system we are talking about with 4 instances, 3 of them in the Ohio datacenter and 1 in Paris. The intuitive jump is notorious, we can see in the superior image, the health of each one of the instances painted in green since their metrics fulfill all our limitations, all of them personalized and adaptable to each need. It also includes a list of alerts where we will get all the notices we capture within each instance and are also labeled by color, according to its severity, giving us an intuitive framework of work.

On the other hand, in this graph we represent the control of a critical service, Ohio. We can see the maximums (dark green color) and minimums (light blue color) with the median (yellow color). This indicates both CPU usage peaks and their average in the last 5 hours, which allows us to adjust to the need according to their peaks.

In this second one, we have the average of all the instances weighted between them, which gives us the weight that each instance has in our infrastructure.

In this case, the average memory usage is observed. The area painted on each one (green for the Ohio instances and yellow for the Paris instances) in this case represents the difference between the average and the minimums, in the case of memory the criticality arrives when we approach 0. Paris, only has one instance, average and minimums just move away. However, in Ohio with 4 instances, peaks and medians move away, if this difference were to grow we could conclude a mismatch between the load of the instances, or the existence of too many temporary peaks, both may require an adjustment of the needs of the system.
Let's simulate now a fall of a key metric (we will remove in the security configuration the ICMP entries of an instance in AWS), let's see what happens:
Let's simulate now a fall of a key metric (we will remove in the security configuration the ICMP entries of an instance in AWS), let's see what happens:

As we see our system alerts us with a red state in the affected instance with the guilty metric and its value, in this case we are detecting the fallen instance (value=0). In the list of alerts we see more in detail the problem, as well as the zone to which it belongs and even a suggestion of which can be the cause. This model is applicable for 4 instances and much more useful for "n", being "n" a number as large as needed, thus abstracting more data the higher its value.
These panels are fully customizable and can include in them the combinations of metrics, aggregations, limits, alerts ... that each administrator wants. In addition, in a single panel not only fit the metrics of cloud instances, we could also add the metrics of our CPDs, and even merge both in the same graphs can have a total view whatever our infrastructure from a single view.
These panels are fully customizable and can include in them the combinations of metrics, aggregations, limits, alerts ... that each administrator wants. In addition, in a single panel not only fit the metrics of cloud instances, we could also add the metrics of our CPDs, and even merge both in the same graphs can have a total view whatever our infrastructure from a single view.
Conclusion
The cloud as the base on which to base our services, has very interesting competitive advantages, despite the dependencies with suppliers it generates. All the promises to migrate to Cloud can only be achieved, if we are capable, starting from a good knowledge of taking control of the real needs. This is a problem that is difficult to tackle and requires the greatest possible abstraction in order for it to become the profitable solution it seeks. Muutech offers adapted solutions that will help you optimize and control the health of your system in real time, speeding up the detection of faults and avoiding falls, keeping the processes running.

CEO & MANAGING DIRECTOR
Expert in IT monitoring, systems and networks.
Minerva is our enterprise-grade monitoring platform based on Zabbix and Grafana.
We help you monitor your network equipment, communications and systems!
Subscribe to our Newsletter


