
Monitor your HTTPS certificates with Zabbix
June 19, 2019
Dashboards are for the summer
August 13, 2019
Database Monitoring with PMM
Nowadays information is a matter of vital importance for the survival of a company, not only the private information of our customers and its treatment, also the information we keep about our work processes and tasks, our applications for order management and sales or our CRM. In most of these cases there is one common element that acts as heart: Our database.
Databases are often forgotten because they can be a relatively tedious element and their correct management and maintenance require specific knowledge. However, following the simile of the heart, the appearance of performance problems or latency can have very serious and sometimes irreversible consequences.
Databases are often forgotten because they can be a relatively tedious element and their correct management and maintenance require specific knowledge. However, following the simile of the heart, the appearance of performance problems or latency can have very serious and sometimes irreversible consequences.

Let us cite a brief example. Some time ago, the giant Google decided that its search engine would increase from 10 results to 30, which meant that the time to perform a search would increase from 0.15 seconds to almost 0.5. The impact of this decision was the loss of millions of users for reasons of slowness, one of the main criteria that users have when surfing the Internet.
No longer thinking about a company as big as Google but in most of our PYMEs, what impact would it have if our database took more than 1 second to show our catalog? In short, catastrophe. In that second users are already comparing offers from our competitors or other options alien to us. The most serious thing about all this is, would we have noticed? possibly not.
And now, already leaving the world of the internet and entering the world of our internal management applications, what would happen if the hard disk, log or tablespace of the database were filled? Again, catastrophe. The systems that are connected to it would stop or fall, we would receive incidents and customer calls asking for explanations within a few minutes and we could take hours to solve something that could have been avoided.
To conclude the analogy, like doctors, the only way to prevent these ills is to keep the heart healthy.
Percona Monitoring & Management
There are several products for database monitoring, one of them is "Percona Monitoring & Management" or PMM.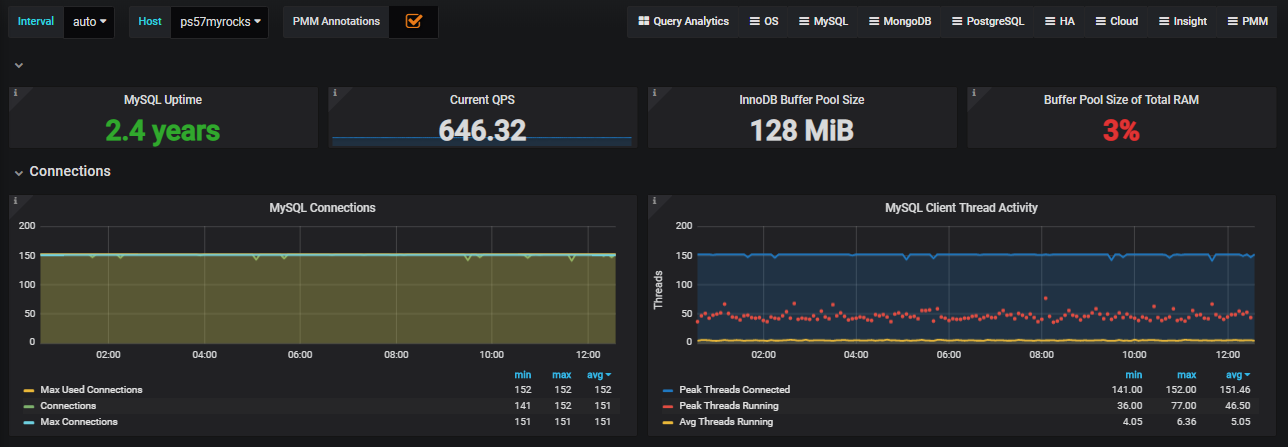
This product gives us a very complete view of everything that happens, allowing us to select the time interval we want to study and select the database we want to see individually, improving the user experience.
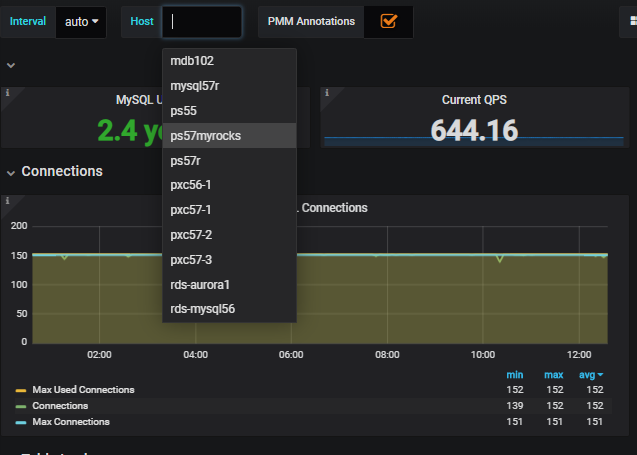
The set of graphics and elements to select gives us a great ease when configuring dashboard to our liking and cover many, if not all, our needs.
It is compatible with different types of databases: MySQL, MongoDB, PostgreSQL. It also has options to monitor our databases in the cloud.
It is compatible with different types of databases: MySQL, MongoDB, PostgreSQL. It also has options to monitor our databases in the cloud.

All the images that we are showing come from the Online demo that PMM has available and that allows us to test your application.
PMM architecture and detail
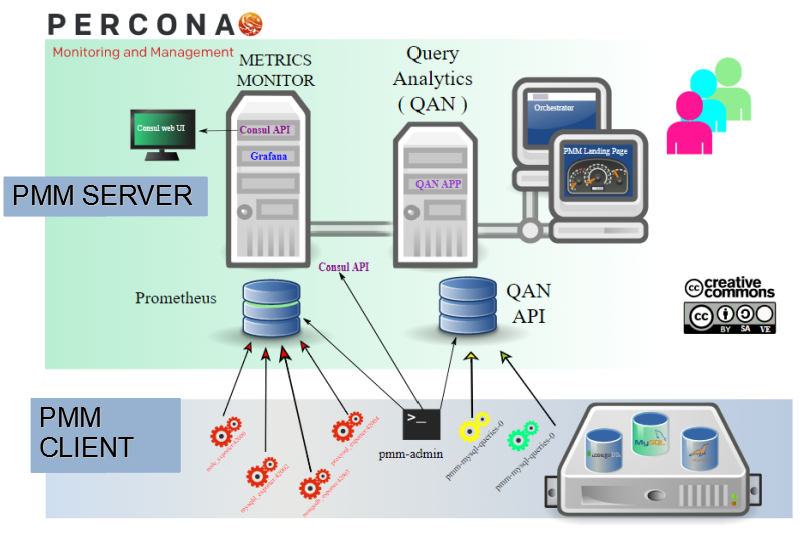
The percona solution is based on a client-server model that facilitates scalability.
As we can see in the picture, we have a PMM server and a PMM client.
Metrics Monitor gives us all the metrics related to the status of our database: CPU, memory consumed, number of database connections, table status, users, etc. Almost all the information we need about monitoring our database.
- PMM Server: The function of the server is to receive, request and save the information obtained by PMM clients. Depending on the type of information, this is stored in a MySQL database or in Prometheus, which is a type of database designed to store information based on time (time series). The interaction with the agents is done via a REST API and it shows the results in the Grafana dashboards.
- PMM Agent: It is necessary to install an agent on each machine that has databases to monitor. The application that manages the agent is "pmm-admin". With it, we configure the metrics we want and the server IP. When we configure the metrics, "pmm-admin" will create daemons that will run in background and will be responsible for retrieving the information and sending it to the server.
Query Analitycs
If we look at the server side of PMM, we can see that we can divide it into two clearly differentiated parts: "Metrics Monitor" and "Query Analitycs".Metrics Monitor gives us all the metrics related to the status of our database: CPU, memory consumed, number of database connections, table status, users, etc. Almost all the information we need about monitoring our database.

Query Analitycs, on the other hand, is a contribution of differentiating value. This functionality has the goal of measuring the time and performance of the queries that are made in a database. In order not to adopt such a technical language, the queries are all the requests and operations that we ask our database to do. From inserting a new client, to consulting the status of an order or showing on screen the catalogue of our services to show them to a client.
Returning to the example of the catalogue of products that an user can consult in Internet, here we could see the requests that give more workload to the database.
Returning to the example of the catalogue of products that an user can consult in Internet, here we could see the requests that give more workload to the database.
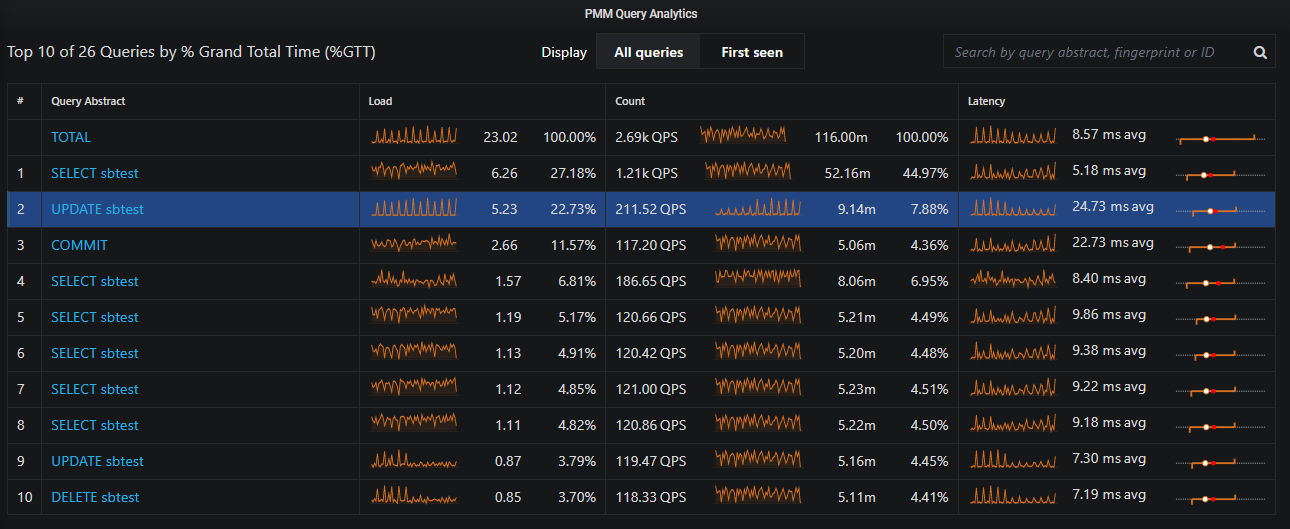
This functionality not only allows us to detect problems in operation, but also gives us proactive information of what would happen if our updates reached the production environments, where our customers or operators are connected.
In the previous image we observe that the second type of application has a load of 22.73% of the work and is the one that has the highest latency of all with 24.73 milliseconds on average.
If we select the operation, Query Analitycs allows us to know it in greater detail.
In the previous image we observe that the second type of application has a load of 22.73% of the work and is the one that has the highest latency of all with 24.73 milliseconds on average.
If we select the operation, Query Analitycs allows us to know it in greater detail.
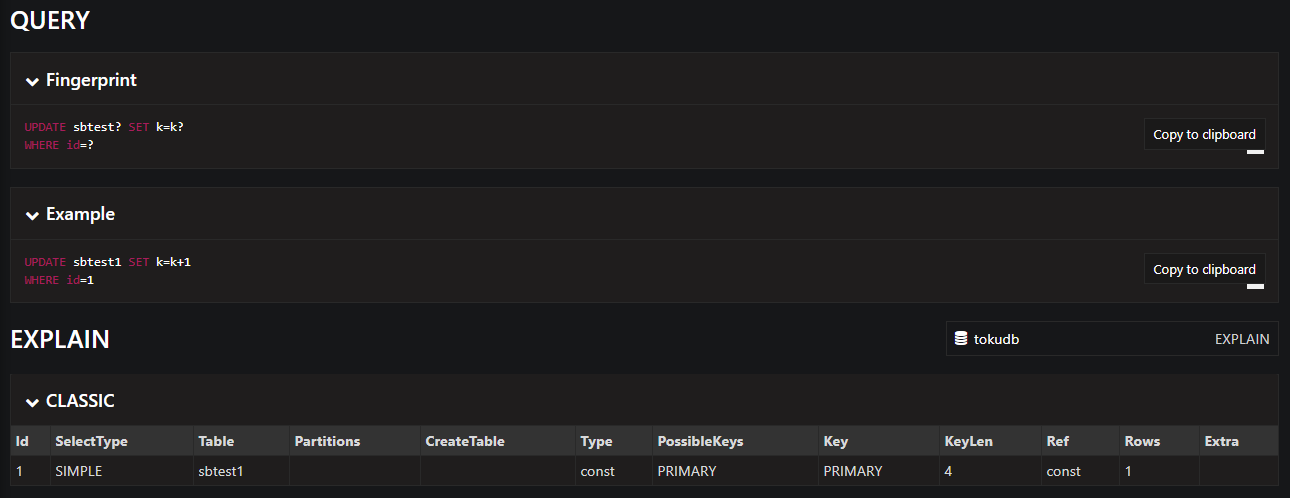
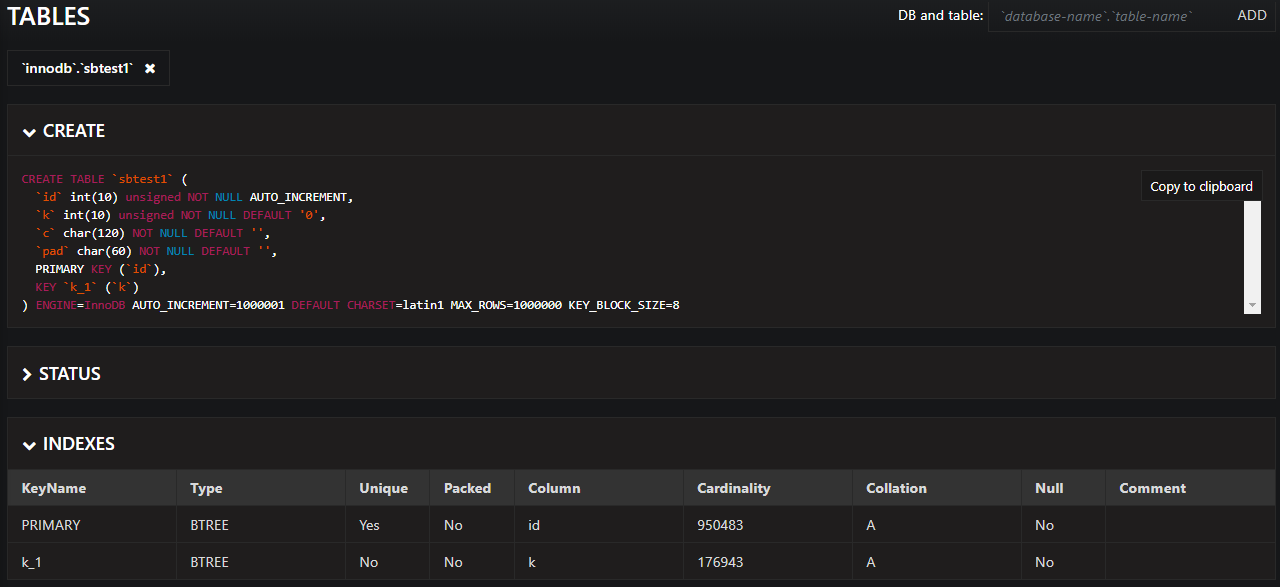
In this way, the technical team could fix issues, if these times increase, and optimize the performance of the database, improving the usability of applications and avoiding many problems.
If you would like more information or a consultation, remember that at Muutech we are specialists in monitoring systems and will be happy to help your business stay healthy and fit.
If you would like more information or a consultation, remember that at Muutech we are specialists in monitoring systems and will be happy to help your business stay healthy and fit.

CEO & MANAGING DIRECTOR
Expert in IT monitoring, systems and networks.
Minerva is our enterprise-grade monitoring platform based on Zabbix and Grafana.
We help you monitor your network equipment, communications and systems!
Subscribe to our Newsletter


