

Differences and alternatives to MES, ERP, SCADA
September 10, 2024
Do you really need a MES?
May 20, 2025
KEY KPIs FOR industrIAL MAINTENANCE
In industry, efficiency and productivity depend on the ability to identify and act on the day-to-day operations of our plant using the most correct data possible in each case.
Industrial maintenance KPIs are essential to achieve this goal, as they allow analyzing equipment performance and optimizing processes to ensure operational success.
In this blog we break down the main indicators to consider, their formulas, their most typical uses and how we can visualize them for effective analysis.
What are the main KPIs in industrial maintenance? 🤔
They are those that evaluate critical aspects such as equipment availability, repair efficiency and machine downtime. In other words, they are indicators whose use simplifies decision-making in terms of repairs and maintenance. And they make it possible to detect opportunities for improvement, optimize resources and guarantee operational continuity.

These are the key maintenance metrics that we will explain in detail below:
- MTTF: Mean Time To Failure
- MTBF: Mean Time Between Failures
- MTTR: Mean Time To Repair
- MTTD (Mean Time To Detect) / Breakdown Response Time
- Availability and Downtime
1. Mean Time To Failure (MTTF): Anticipating failures
MTTF or “Mean Time To Failure” measures the average time a piece of equipment operates before it fails beyond repair. More specifically: how long it takes on average for an unrepairable piece of equipment, item, or device to fail. E.g. a light bulb, a sensor, a roller on a manufacturing conveyor belt…
This KPI is very useful to know when to do scheduled maintenance, or to have a good annual cost data of each recurring supply I need.
For the MTTF to be meaningful, the longevity of the elements must be taken into account. The longer the longevity, the longer the total period over which the KPI is calculated. For example, a PLC should last for many years, so in order to calculate its MTTF reliably, it should not be calculated over too short a period (less than its estimated useful life), as it would be distorted.
For all these reasons, MTTF does not make much sense for repairable or long-lasting elements.
As it is an indicator that will allow us to calculate the quality and durability of the devices, it is very common to measure it using several similar devices or of the same model simultaneously. For example, if I want to measure the MTTF of a type of temperature sensor and I have 10 installed in my plant, we will consider the operating times of all of them to see their real average life (sometimes the manufacturer does not provide this data or it does not coincide exactly with the reality of our factory, so this KPI helps us to check it).
Formula:
🧪 MTTF = Total operating time until the equipment or device definitely fails / Number of devices
Practical example:
Let’s suppose we use a type A sensor model at 10 points in our plant. And over a year of operation (5,000 hours) they have had to be replaced, using a total of 22 sensors over the year. The MTTF would be as follows:
👉 Total operating time: 10 x 5,000 hours = 50,000 hours
👉 Total number of sensors used: 22 sensors
👉 MTTF = 50,000 / 22 = ~ 2,273 hours
This would indicate that, on average, every 2,273 hours we have to replace a type A sensor.
How to use it:
A low MTTF may indicate inadequate operating conditions or poor device quality. If this time decreases, it could be a sign that the quality of the product or supply we use is deteriorating.

2. Mean Time Between Failures (MTBF): Measuring reliability
MTBF or “Mean Time Between Failures” measures the average time between consecutive failures on repairable equipment. This KPI is crucial to assess reliability or durability, the higher the value, the more time elapses between failures.
MTBF is commonly used in production lines, engines, machines… in other words, in elements that can be repaired.
Formula:
🧪 MTBF = Total operating time / Number of failures
Practical example:
If a machine operates for 1,000 hours with five failures, its MTBF would be:
👉 MTBF = 1,000 / 5 = 200 hours
If a machine has an MTBF of 200 hours, it means that, on average, it can operate for that long without interruptions. An increase in this KPI reflects an improvement in performance.
How to use it:
A high MTBF reflects efficient equipment, while low values indicate a need for improvement.
💡 It’s quite usual to confuse MTBF with MTTF, or to consider that MTTF is only for irreparable elements. However, machines are not repairable forever either, so in the end we will have both an MTBF and an MTTF (although this one does not make as much sense).
Imagine an engine that breaks down every 6 months: its MTBF would be 6 months, but if it fails definitively after 10 years, its MTTF would be 10 years. But in such a long-life item, it may not even replace by the same item or brand, so this analysis would become meaningless.

3. Mean Time to Repair (MTTR): Speeding up repairs
MTTR or “Mean Time To Repair” measures the average time required to repair equipment after a failure, i.e. from the time you start repairing a machine until it is repaired. It is key to assessing the efficiency of the maintenance team.
Formula:
🧪 MTTR = Total repair time / Total number of repairs
Practical example:
If a machine has the same failure 3 times in a year and is repaired the first time in 4h, then in 3h and then in 2.5h, the MTTR would be:
👉MTTR = (4 + 3 + 2.5) / 3 = 3.17 hours
How to use it:
A high or increasing MTTR may reflect a lack of resources, spare parts or adequate training.
To analyze this KPI, instead of just looking at its value at a given moment, it is interesting to follow its evolution over time. For example, if the MTTR decreases, it is an indication of improvement (we are repairing better and faster), and if on the other hand it increases, it is a sign that the repair is becoming more and more costly.
It is therefore particularly useful to have the MTTR and its evolution per machine and per failure. This also allows us to have an estimate of how much time we will need for the next repair.
💡 Practical implementation:
Set up automatic alerts when MTTR exceeds a threshold value and prioritize interventions to reduce it.
4. Mean Time to Detect (MTTD) and Breakdown Response Time: How long it takes to detect and respond to a breakdown
MTTD or “Mean Time To Detect” is the time that elapses from the time a breakdown occurs until it is detected. This is not usually very interesting in industry, since when a machine fails, detection is practically immediate (by the operator, maintenance personnel…).
Therefore, it is much more interesting to use the Breakdown Response Time, which tells us how long it takes to get to the breakdown and start repairing it.

High Breakdown Response times can be indicative of a bad alert system, poor communication, lack of vision of what is happening in the plant… Combining Breakdown Response Time with MTTR can be especially useful in prioritizing breakdown resolution. By comparing these KPIs per machine or per breakdown, we can detect interventions where it takes longer to reach the repair than to execute it. Ideally, we would like to solve the faults that are quicker to repair before those that are very costly in terms of time, as this will help us to improve the overall efficiency of the plant.
Practical example:
Let’s imagine the following scenario:
👉 I’m repairing Line 1.
👉 During the repair, another breakdown occurs on Line 2.
👉 What do we do? A priori, I will continue repairing Line 1 before going to Line 2.
However, if we have the Breakdown Response Time and MTTR indicators, we will have very valuable information:
✅ MTTR of Line 1 breakdown: ~10 hours.
✅ MTTR of Line 2 breakdown: ~1 hour.
So what do we do?
👉 If we keep repairing Line 1 it will be completely inefficient. Since Line 1 will be down for 10 hours and Line 2 for 11 hours. In total 21 hours of production downtime.
👉 However, if we change and prioritize Line 2, the result will be very different. Line 2 stop: 1 hour, Line 1 stop: 11 hours. In total we have had 12 hours of production downtime.
5. Availability and Downtime: Maximizes uptime and overall equipment effectiveness
OEE or “Overall Equipment Effectiveness” is an indicator that measures the overall effectiveness of a piece of equipment by considering three main factors: availability, performance and quality. Although each component is relevant, here we will focus on availability, which is directly related to maintenance.
Availability measures how long a piece of equipment is operational compared to the total planned time. It is essential to identify how much disruptions affect overall performance.
Complementarily, Downtime measures how long a machine remains idle due to: breakdowns, unscheduled maintenance or other factors..
These two KPIs directly affect productivity.
Formulas:
🧪 Availability (%) = Operational time / Total planned time
🧪 Downtime (%) = Total downtime / Total planned time
Both add up to 100% of the Total planned time.
Practical example:
A machine has a total planned time of 480 minutes per shift, but it was stopped for 30 minutes. Its availability and downtime would be:
👉 Availability = (480 – 30) / 480 = 93,75%
👉 Downtime = 30 / 480 = 6,25%
This example appears to provide a good level of availability, but by detailing the causes of downtime, it may be possible to identify whether further improvement is possible.
How to use it:
As we have just mentioned, it is necessary to analyze the causes of downtime to minimize its effects on production. And be able to apply specific strategies to reduce it, such as predictive maintenance, equipment training, alerts and automation.

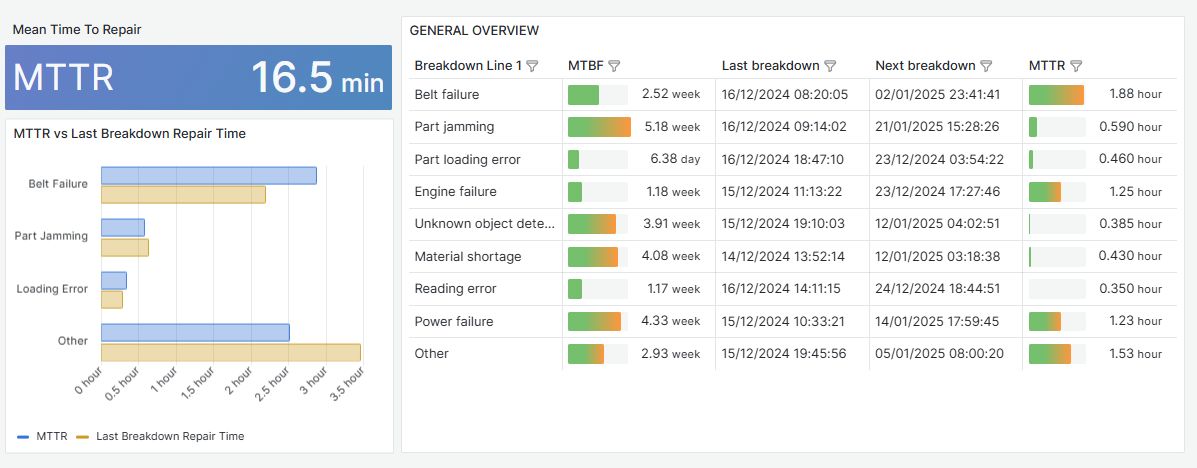
How to visualize industry KPIs: Data that speaks, the key to effective analysis 🗝️
Measuring KPIs is only the first step. True efficiency comes from visualizing data in a clear and personalized way. A well-designed dashboard allows us to:
✅ Identify patterns over time.
✅ Compare metrics across different lines or teams.
✅ Make quick, data-driven decisions.

This dashboard is just one example that is designed to simplify the analysis of your industrial maintenance KPIs.
With an intuitive and customized visualization like the one in the image, we will be able to:
✅ Optimize operations through the analysis of historical data, trends…
✅ Integrate data from multiple systems in one place.
✅ Have dashboards tailored to our specific needs.
✅ Set up automatic alerts for key metrics such as MTTR or downtime.
✅ Anticipate problems through real-time information.
And this can make all the difference to our maintenance team, as maintenance dashboards can often be too generic, too complex, or do not reflect our real needs to optimize maintenance.
Conclusion. Optimize your plant with industrial maintenance KPIs ✍️
Indicators and KPIs are fundamental and we have just seen that this also applies, and very much so, to maintenance in industry.
Industrial maintenance KPIs such as MTTF, MTBF, MTTR, MTTD, Breakdown Time, Availability and Downtime provide a solid basis for evaluating our industrial maintenance procedures and making informed decisions. Which will be key to achieving better productivity and overall performance.
Would you like to see our industrial monitoring platform Minerva in action?
Enter our demo 👇
Would you prefer us to help you take the first step towards more efficient and cost-effective maintenance? 👇

CTO & TECHNICAL DIRECTOR
Expert in industrial monitoring and data analytics.
We tell you how to improve decision-making and production efficiency in your plant, without wasting time generating reports. Your plant at a glance!
Subscribe to our Newsletter


