Minerva Cloud - Enterprise SaaS
(powered by Zabbix and Grafana)
Your Zabbix and Grafana based monitoring system is now on the cloud.
Get your IT and Telco infrastructure fully monitored without having to install anything, secured and on the cloud.
Minerva is Muutech's enterprise cloud monitoring software, in a SaaS version.
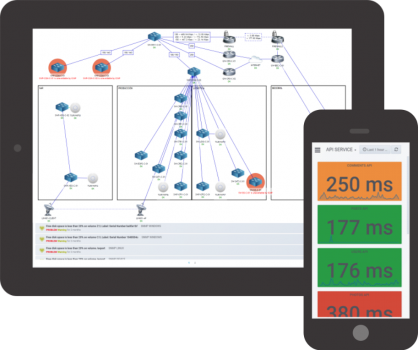
😞 We understand you...
You need a plan!
What our customers say

Muutech has presented us with a platform that allows us to control and analyze processes in a fast, simple and very visual way. With it we can anticipate possible incidents of the monitored systems, reducing considerably the time of resolution of the same.
Juan Vilas
IT Systems Manager at Hogarlín S.A.

The tool has provided us with visibility to remote stations that previously remained unseen when dealing with service incidents. This has improved our ability to diagnose and solve problems, which has translated into a better user experience for our customers. Where previously we had to ask the crew to give us device readings, we can now access that data directly and easily.
Carlos Derqui
CEO at Syntelix

The platform allows me to see the IT network and hardware infrastructure, detecting problems in real time through the dashboards, and connecting directly to the computers as soon as any alarm is triggered, saving me a lot of time in detecting and solving problems in the company's computers.
Iago Fernández
ICT Manager at Viña Costeira
Monitoring is easy, setting up the platform is not so much.
We are saturated with information, wonderful services, tools that do everything “on their own” and promise to monitor everything with a click.
Almost nothing impresses us.
If you want to do it yourself but with the convenience of not having to install and configure the whole platform from scratch, you need a tool that provides you with this ability.
And with more reasons these days, you need a system that allows you to do it remotely, from home.
Only 3 Steps to get it running!
Generation environment on the Cloud
Once you are convinced that you want Minerva cloud, contact us and we will set up a suitable cloud environment in less than 48 hours.
If you don’t tell us in your request, our team will ask you some questions in order to properly size your cloud server.
Grafana Integration
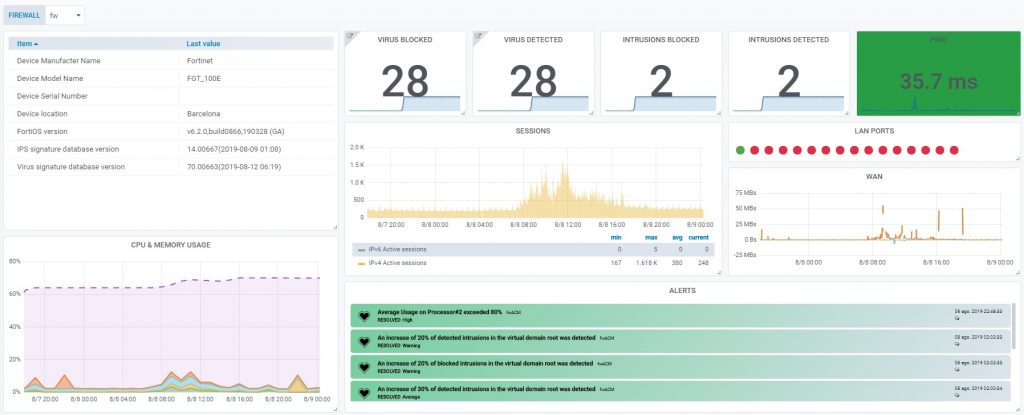
Would you like to take Minerva cloud visualization to another level? We offer the possibility to integrate Grafana with the cloud monitoring platform which will give a different view to your monitoring dashboards.
Do not hesitate to ask us for it as soon as you contact us.
Downloading Zabbix proxy and installing the certificates
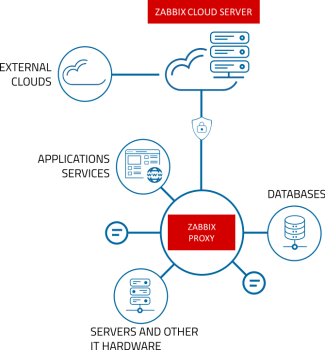
As a last step you will need to download and install Zabbix proxy. You can get how to install it from Zabbix website documentation.
We will send you an Email with your PSK key you will need to connect you proxy with your Zabbix server…and that’s it! You have already your Zabbix running on the cloud.

Pricing
Pay only for the data you are monitoring.
Thanks to our SaaS model we do not bill by equipment but by the nvps you consume.
General
- For all billing plans
- Free hosting
- Storage space included
- 5x8 Email support
Zabbix-25
- Up to 20 nvps (~25 hosts)
- * Grafana Integration: +12.50€ / month
Zabbix-100
- Up to 77 nvps (~100 hosts)
- * Grafana Integration: +27€ / month
Can’t find the plan that fits your needs? contact us and we will inform you of all the plans we have
Don't be left with doubts
Minerva cloud is a monitoring platform developed by Muutech which is mainly based in Zabbix and Grafana.
Minerva is our enterprise cloud monitoring software, and has been developed in order to get all the advantages of a SaaS. It allows you to monitor in the cloud with all the benefits of a cloud platform.
Very simple, the first thing you have to do is contact us showing your interest and we will set up the test environment for you.
Minerva is our own development which is based on Zabbix and Grafana softwares.
We want to avoid the misuse of the tool and that people do not value it.
The initial cost is a single payment of 10€ and basically supports the costs of generation and set up of the cloud server.
The initial payment of 10€ includes free monitoring of all the elements you want for 14 days. From the 14th day, we will apply the normal rates.
Yes, we love the combination of these two tools and therefore we offer the possibility of having zabbix + grafana cloud, together. The inclusion of Grafana as an additional visualization platform to Zabbix, has an additional cost as indicated in the price tables above.
The billing model is a SaaS. Rates vary depending on the nvps, as can be seeing in the price list above. Contact our sales team and we will give you more details.
We work with the best technologies on the market

Zabbix
It is a system for monitoring the capacity, performance and availability of servers, equipment, applications and databases, among others. It also offers advanced monitoring, alerting and visualization features that even some of the best commercial applications of this type do not offer.

Grafana
It is a tool for consulting and visualizing data series in a more aesthetic and stylish way. It is a very powerful tool, with a very elaborate query editor that allows you to choose from the metrics you have recorded and to perform all the treatment you need with them.

