
Zabbix
We help you to monitor your network equipment, communications and systems
Get the most out of your systems and stay one step ahead of problems!
Monitoring with Zabbix
From Muutech we have tested and adopted Zabbix, a powerful open-source monitoring tool comparable to Nagios, Pandora FMS or DataDog.
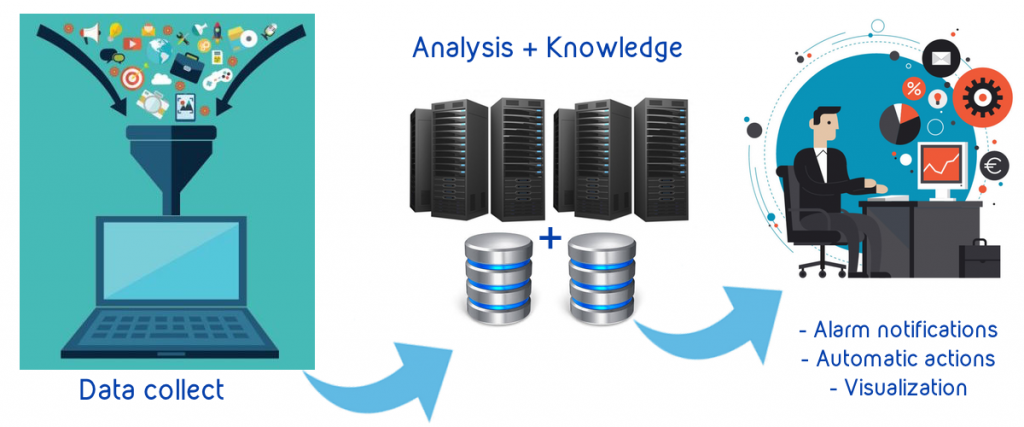
Zabbix is a distributed monitoring software that allows continuous monitoring in real time of servers and other network equipment. Zabbix generates the information through data notifications and fully customizable rules.
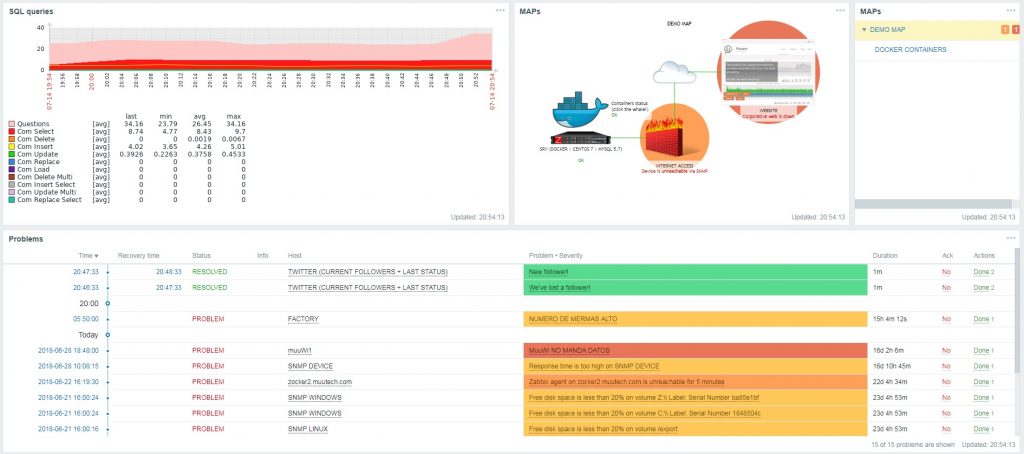
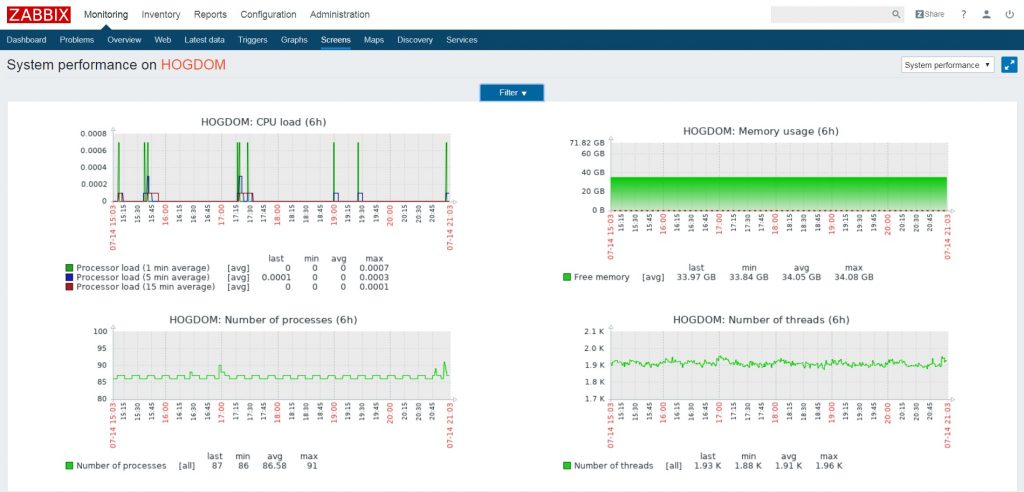
Zabbix web interface provides an efficient way to visualize all monitored components in several ways (graphs, tables, maps, screens, etc.)
Why Zabbix?
The answer is very simple, Zabbix is an open source based technology with a simple and flexible web interface with endless possibilities, in which plugins can be used to check the status of the platform. It also allows from infrastructure monitoring (networks and servers), performance and application monitoring (APM) to transactional business monitoring (BAM).
But without any doubt, Zabbix stands out for its scalability and robustness, and is that Zabbix, which has been conceived in a modular way, supports thousands of nodes and has a great ability to specify topological hierarchies, as well as a powerful template and trigger definition system based on regular expressions.
Zabbix major features
- Distributed monitoring with centralized web administration, so data collection is not interrupted in case of network problems
- Website monitoring with browsing patterns and navigation scenarios
- Active / Passive operating mode:
- Zabbix server retrieves the data through the agents installed on the monitored elements, and / or,
- The monitored elements are the ones that send the data to the Zabbix server
- Web interface for efficient display of network element states, and collected data
- Immediate notification when a problem arises via email, instant messaging, SMS, etc.
- Agentless supervision, through SNMP, SSH, or IPMI monitoring for servers or network elements that do not allow installation of the Zabbix agent
- A high performance native agent (client software for Linux, Solaris, HP-UX, AIX, FreeBSD, OpenBSD, OS X, Tru64 / OSF1, Windows NT 4.0, Windows 2000, Windows 2003, Windows XP, Windows Vista)
- Proactive monitoring for strong interaction with your network equipment (recovery services, extinction, reboots, etc.)
- Automatic detection of servers and network devices, which allows to monitor new servers as soon as they are included in the network·
- Creation of custom plugins to monitor specific or uncommon services
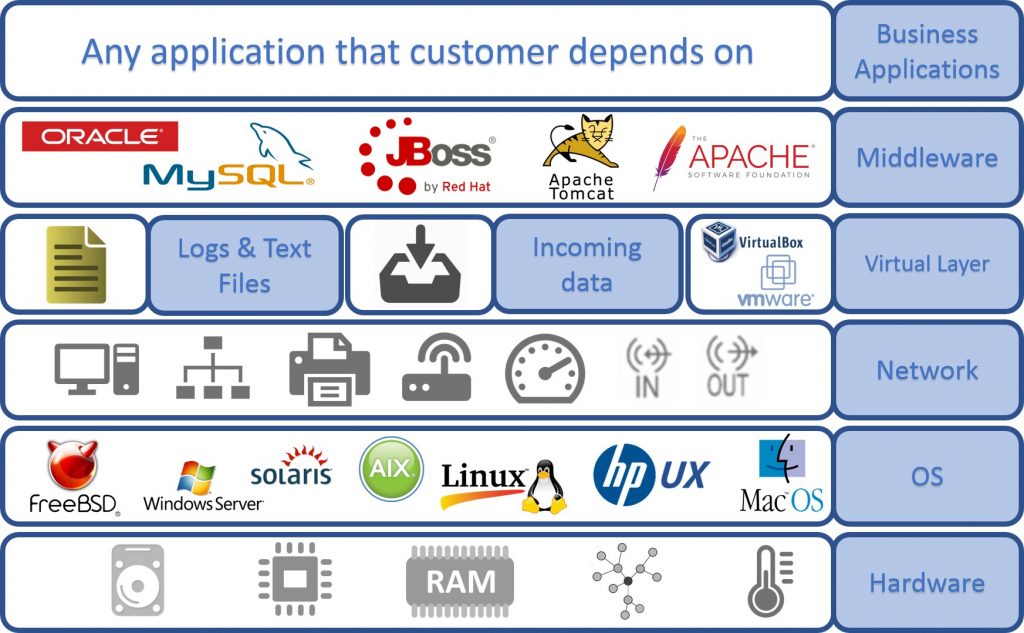
Zabbix allows monitoring of the following network elements
-
Windows Operating Systems (all desktop and server versions from XP), Linux (CentOS, Red Hat, Suse, Debian, Ubuntu, etc.), Mac OS X, Oracle Solaris, HP-UX, IBM iSeries (AS400), IBM AIX, FreeBSD, NetBSD, OpenBSD.
-
Inventory control: software versions, serial number, warranty date, location, etc.
-
Network use: bandwidth, latencies, etc.
-
Web servers (Apache, NGINX, etc.), SMTP, HTTP, HTTPS, etc.
-
Databases: MySQL, PostgreSQL, Microsoft SQL Server, Oracle, MongoDB.
-
Network devices: switches, routers, Cisco access points, HP, Huawei, Juniper, Ubiquiti, Netgear, etc.
-
Cloud Services: Amazon Web Services (AWS), Google Cloud, Microsoft Azure, etc.
-
Virtualization: VMWare, Citrix, Hyper-V, etc.
-
New technologies: OpenStack, Docker, Kubernetes, etc.
-
Services and web pages: access time, authentication, etc.
-
Security: failed logins, antivirus status, alerts, backups (Veeam, etc.)
-
Firewall monitoring (alerts, VPN status, connections, etc.) from Fortinet, WatchGuard, F5 Networks, BlueCoat, etc.
-
UPS: Riello, APC, Delta, Emerson, etc.
-
Java Monitoring: JMX, JBoss, Apache Tomcat, Glassfish, Websphere.
-
Own scripts
-
Database queries
-
Consultations about internal or external APIs
-
Search for patterns in logs, etc.
-
Asterisk switchboards: calls, SIP provider status, etc.
-
Active Directory
-
E-commerce: Magento, Prestashop, WooCommerce, etc
-
ERP: SAP, Salesforce, etc.
-
Android devices: CPU, memory, GPS position, etc.
-
Integration with Ansible.
-
Integration with ticketing tools: Redmine, JIRA, GLPI, ServiceNow.
-
Integration with notification tools: Slack, Telegram, Twitter, PagerDuty.