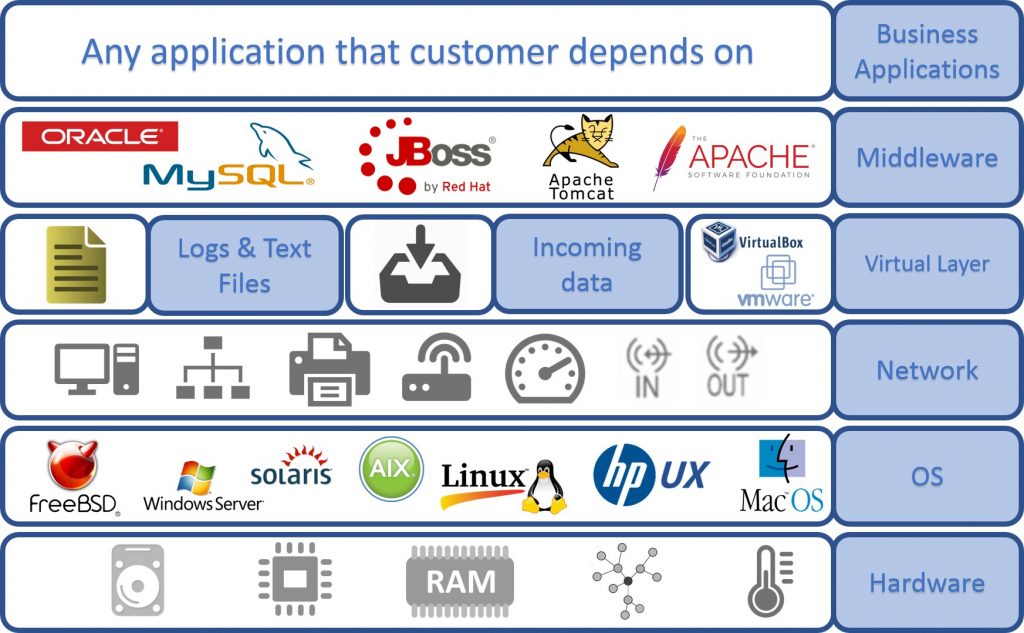
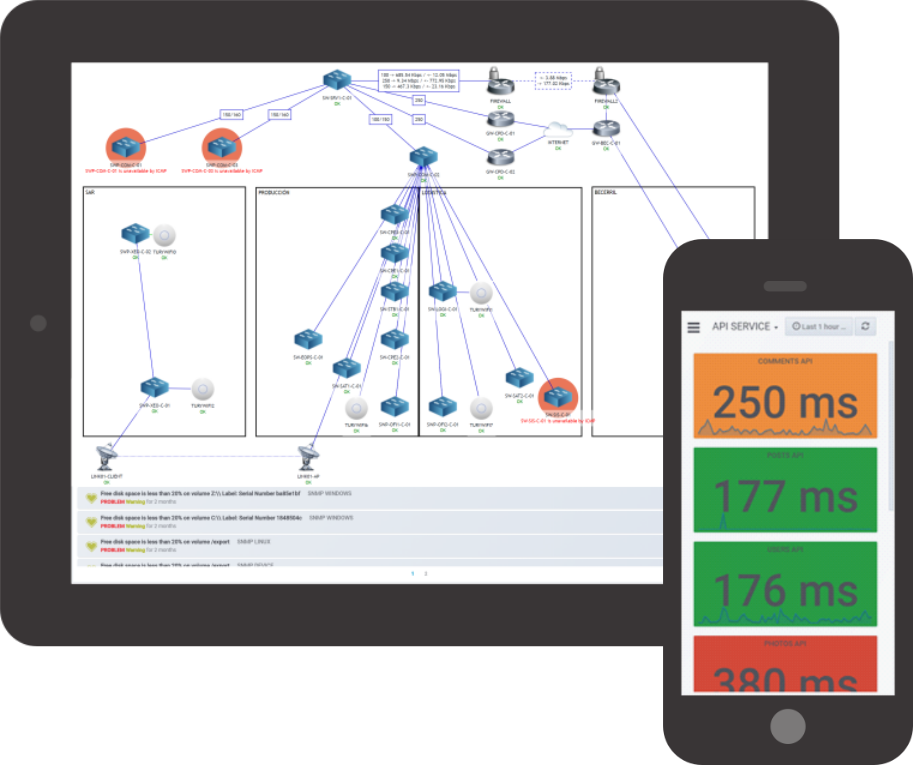
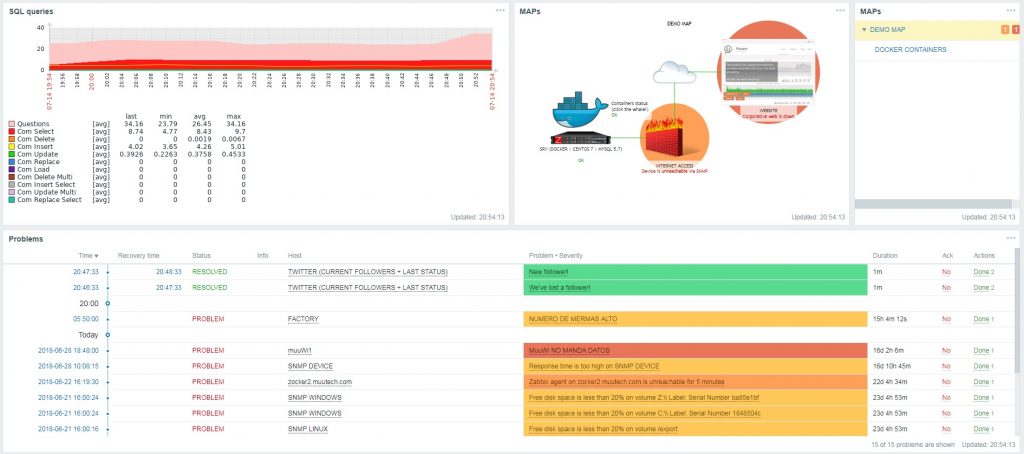
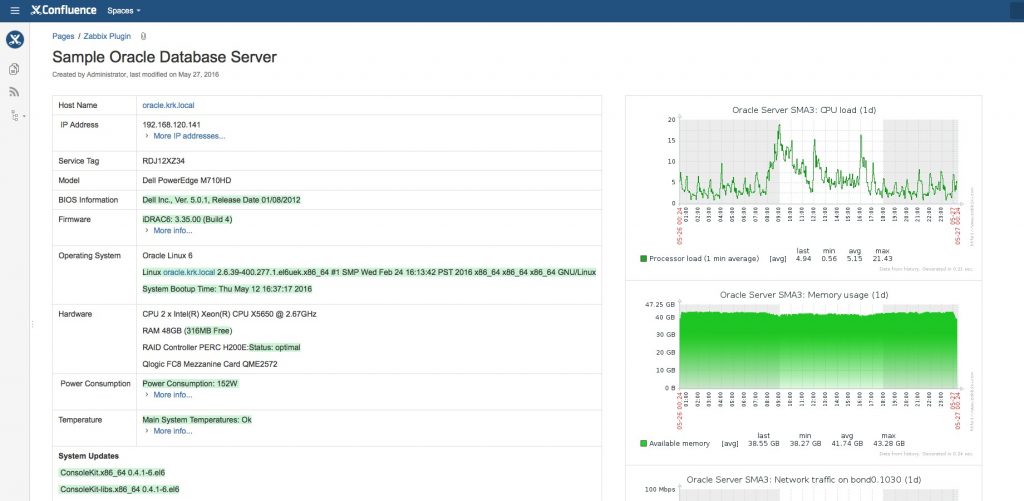
Network Monitoring

We help you monitor your network equipment, communications and systems

Get the most out of your systems and stay ahead of trouble!

Minerva is our enterprise-grade monitoring platform
based on Zabbix and Grafana

Controls

Monitor, control and manage all systems, devices, traffic and applications in your network and communications infrastructure.

Visualizes

Collects information from any information source (servers, routers, switches, UPS, APs, databases, ...) and displays it on custom dashboards

Informs

Alarms designed to your needs. Predicts and corrects incidents before they occur.

Monitor Anything

Solutions for any type of infrastructure, services, applications and computer resources

zbx

Network Elements

Multi-vendor network element monitoring. Network health, performance monitoring, configuration changes

zbx

Servers

Server monitoring, performance, availability (high availability), CPU usage, RAM, etc. Windows, Linux, Solaris, AS400 servers...

zbx

Cloud Services

Monitoring of cloud services such as Amazon Web Services (AWS), Google Cloud or Microsoft Azure

zbx

Web Monitoring

Monitoring of servers and web protocols: Apache, NGINX, SMTP, HTTP, HTTPS, etc.
Monitoring of web services and web pages: access time, authentication, etc.

zbx

Aplications

Monitoring of API status, response times, exposure of internal application metrics, etc.

zbx

Services

Service-oriented monitoring. Just because a server goes down doesn't mean that the service is down, it measures the availability of your services as perceived by the users.

zbx

Virtual Machines

Monitoring of virtual machines on VMWare, Citrix, Hyper-V, etc.

zbx

Databases

Database performance monitoring and queries on MySQL, PostgreSQL, Microsoft SQL Server, Oracle or MongoDB databases

zbx

Security

Monitoring of security elements: failed logins, antivirus status, alerts, backups, ...

Monitoring of firewalls (alerts, VPN status, connections, etc.) of Fortinet, WatchGuard, F5 Networks, BlueCoat, etc.

zbx

JAVA

Monitoring of Java applications through JMX, JBoss, Apache Tomcat, Glassfish, Websphere

zbx

Service SLA

Save time in understanding, monitoring and enforcing service level agreements. Automatic control and reporting of your SLAs.

New Technologies

Integration of new technologies: OpenStack, Docker, Kubernetes, etc.

Main features

Integrated Technologies

Minerva is mainly based on open source technologies such as Zabbix and Grafana. Monitor your entire IT infrastructure. It supports all major technologies:

  • Zabbix Agent
  • SNMP: ready-to-use with custom options
  • Windows and WMI performance counters
  • SSH: for Linux/Unix and MacOS systems
  • HTTP y HTTPS requests
  • API REST that returns XML or JSON
  • Ping, SQL and more
  • Zabbix infraestructure

    Maps and Dashboards

    Identify your entire network using autodiscovery techniques and visualize it through real-time maps and dashboards with dynamic, value-added information.

    Access the configuration of your equipment from the control panel itself in one click, through WIFRA or through integrations with Anydesk or Teamviewer.

    Flexible, Predictive Alerts

    Minerva will alert you to a problem when it discovers unusual drifts or metrics.

    Minerva has multiple built-in reporting mechanisms, such as e-mail, slack, Whatsapp, push notifications, or HTTP requests. You’ll receive notifications directly on your phone, whenever you need them.

    The system is easily customizable and provides alerts, notifications, and scheduling. Avoid receiving hundreds of similar and unnecessary messages by using intelligent dependencies and alarms.

    Dashboard Zabbix

    Integrations

    Minerva allows the integration with following elements:

  • Integration with Ansible.
  • Ticketing tools: Redmine, JIRA, GLPI, ServiceNow.
  • Notificación tools: Slack, Telegram, Microsoft Teams, Twitter, PagerDuty.
  • Datacenter Monitoring

    Control of the state of the communications equipment in your machine room, thanks to the active monitoring of the temperature and humidity of your Datacenter.

    We work with the best technologies on the market

    Zabbix

    Zabbix

    It is a system for monitoring the capacity, performance and availability of servers, equipment, applications and databases, among others. It also offers advanced monitoring, alerting and visualization features that even some of the best commercial applications of this type do not offer.

    Grafana

    Grafana

    It is a tool for consulting and visualizing data series in a more aesthetic and stylish way. It is a very powerful tool, with a very elaborate query editor that allows you to choose from the metrics you have recorded and to perform all the treatment you need with them.

    Convinced? Request a customized demo!